


ISMB/ECCB 2009 brings together scientists from a wide range of
disciplines, including biology, medicine, computer science, mathematics
and statistics. In these fields people are constantly dealing with
information in visual form: from microscope images and photographs of
gels to scatter plots, network graphs and phylogenetic trees,
structural formulae and protein models to flow diagrams; visual aids
for problem-solving are omnipresent. Some of the works of the first
such exhibition at the ISMB 2008 in Toronto combine outstanding beauty
and aesthetics with deep insight that perfectly proves the validity of
our approach or goes beyond the problem's solution. Others were
surprising and inspiring through the transition from science to art,
opening our eyes and minds to reflect on the work that we are
undertaking.
The Art & Science Exhibition@ISMB/ECCB 2009 presents the artworks that have been generated as part of research projects. They are also soliciting images resulting from creative efforts that involve scientific concepts or employ scientific tools and methods.
The Art & Science Exhibition@ISMB/ECCB 2009 presents the artworks that have been generated as part of research projects. They are also soliciting images resulting from creative efforts that involve scientific concepts or employ scientific tools and methods.
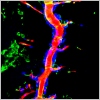
Ben-Zion Shilo Weizmann Institute of Science, Israel The picture shows the dorsal trunk of the Drosophila embryonic tracheal system. Apical accumulation of filamentous actin (green, observed as white) generated by Diaphanous/Formin is responsible for secretion to the lumen of antigens like 2A12 (red) via MyosinV-driven vesicles, but not proteins secreted through the septate junctions like Verm (blue). Tracheal nuclei are marked by staining for Trachealess (blue) |
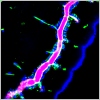
|
Ben-Zion Shilo Weizmann Institute of Science, Israel The picture shows the dorsal trunk of the Drosophila embryonic tracheal system. Apical accumulation of filamentous actin (green, observed as yellow) generated by Diaphanous/Formin is responsible for secretion to the lumen of antigens like 2A12 (red) via MyosinV-driven vesicles, but not proteins secreted through the septate junctions. Tracheal nuclei are marked by staining for Trachealess (blue). Massarwa, Schejter and Shilo, Dev. Cell, in press (June 2009). |
|
Mati Mann Weizmann Institute of Science, ISRAEL Osteoclastogenesis Osteoclasts are monocyte-derived, giant multinucleated cells whose primary function is bone-resorption. Upon differentiation, the mature osteoclast acquires specialized cellular features that enable it to resorb mineralized bone. These features include multinucleation and the formation of a sealing zone structures comprised from the actin cytoskeleton. The aim of this project is to uncover the role of miRNAs and their target mRNAs in the differentiation, adhesion and resorptive function of osteoclasts by taking a combined bioinformatics and functional genomics approach. To this end, a functional screen using a library of hundreds of viral miRNA vectors was performed. After infection with the different miRNA species, osteoclast morphology and actin organization are recorded using high throughput fluorescence microscopy. The presented image exemplifies osteoclast morphology as can be seen by the actin and nuclear staining. |
 |
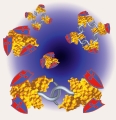
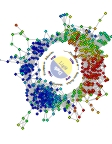
Eyal Akiva The Hebrew university of jerusalem, ISRAEL Hooks and shields: built-in loops allow versatility in domain-domain interactions Compilations of domain-domain interactions based on solved structures suggest there are distinct domain pairs that are used repeatedly in different protein contexts to mediate protein-protein interactions. However, not all protein pairs with the corresponding domains that can potentially mediate interaction do interact, even when they are colocalized and coexpressed. It is conceivable that there are structural and sequence features, below the domain level, which play a role in determining the potential of domains to mediate protein-protein interactions. Here, we discover such features by comparing domains that, on the one hand, mediate homodimerization of proteins and, on the other, occur in different proteins that are documented as monomers. Intriguingly, this comparison uncovered surface loops that can be considered as determinants of the interactions. There are enabling loops, which mediate the domain interactions, and disabling loops that prevent the interactions. The presence of the enabling/disabling loops is consistent with the fulfillment/prevention of the interaction and is highly preserved in evolution. This suggests that, along with the preservation of structural elements that enable interaction, evolution maintains elements intended to prevent unwanted interactions. The enabling and disabling loops discovered in this study have implications in prediction of protein-protein interactions, by pointing to the protein regions that determine the interaction. Our results extend the hierarchy of attributes that collectively establish the modularity of domain-mediated protein-protein interactions. |
 |
Rotem Bar-Or The Weizmann Institute of Science, ISRAEL Nebulous Distance This image was produced as a part of a spatial analysis attempt for cloud fields, in order to define cloud field boundaries when observing them from space. The information that is presented here is the Euclidian distance field of a random distributed disk-shaped cluster of single-pixel clouds. The scale is logarithmic, so smaller values are emphasized. Though the image holds an accurate analytical data with very strict limitations and simple geometry structure, it gives warm feeling of movement. | 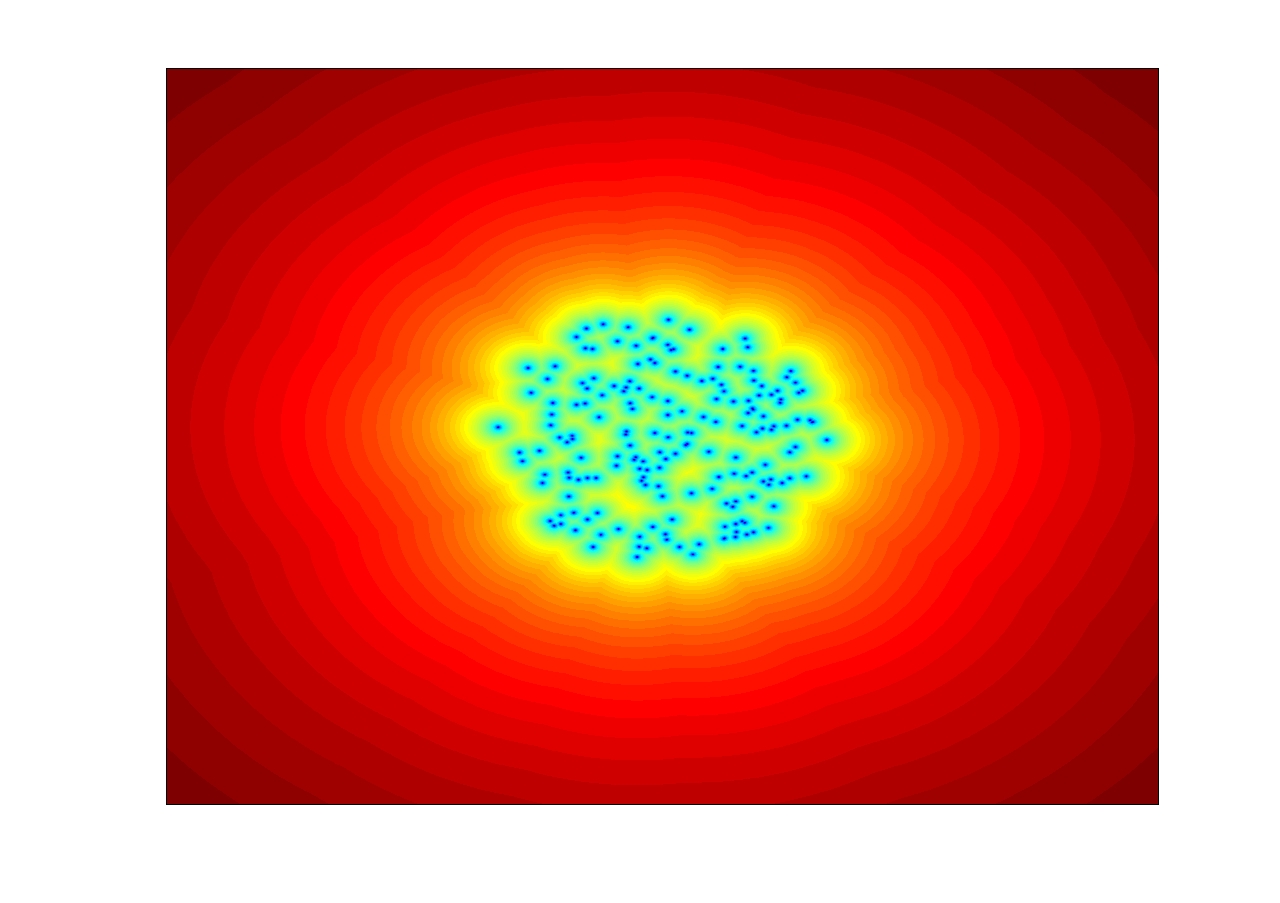 |
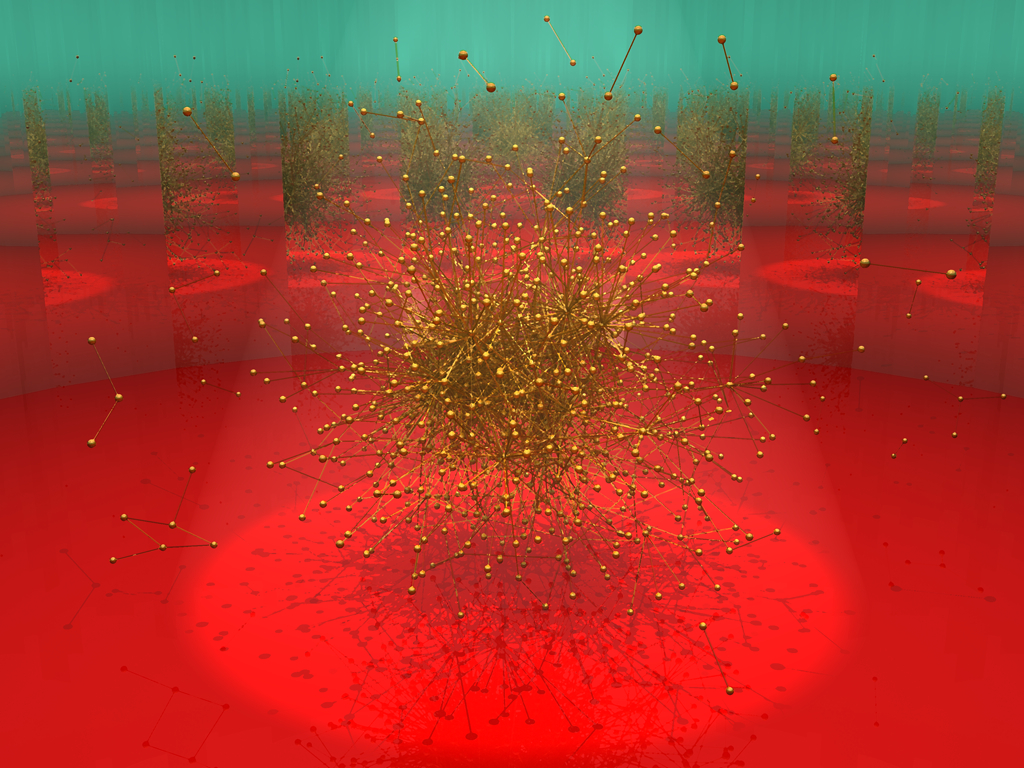
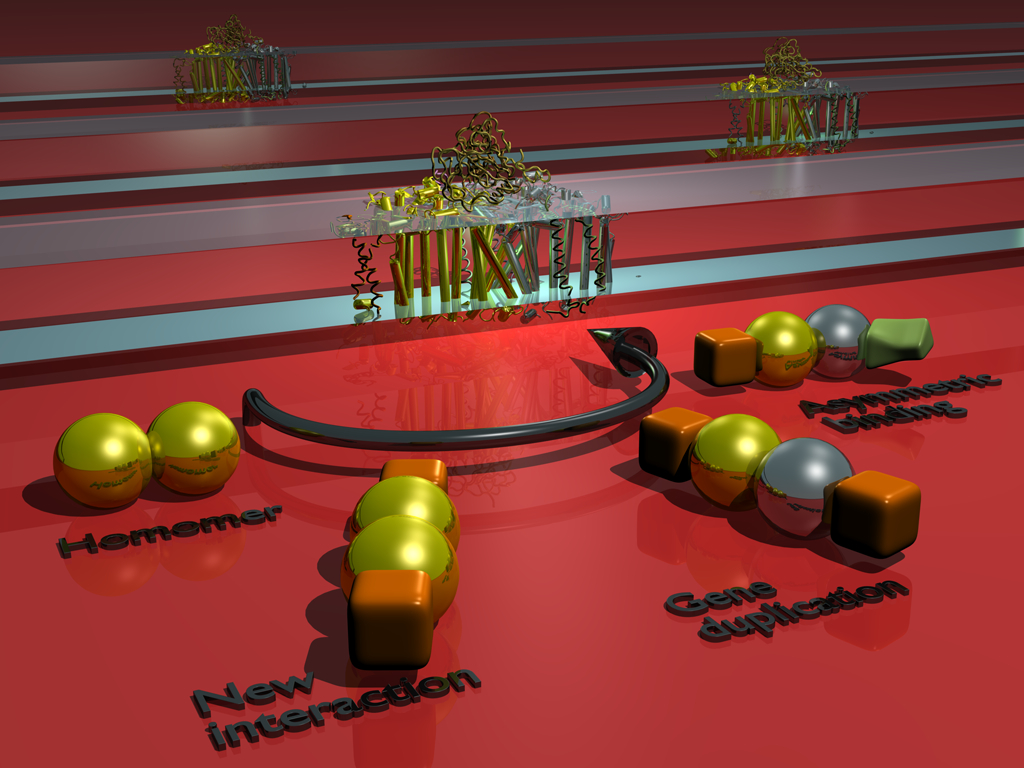
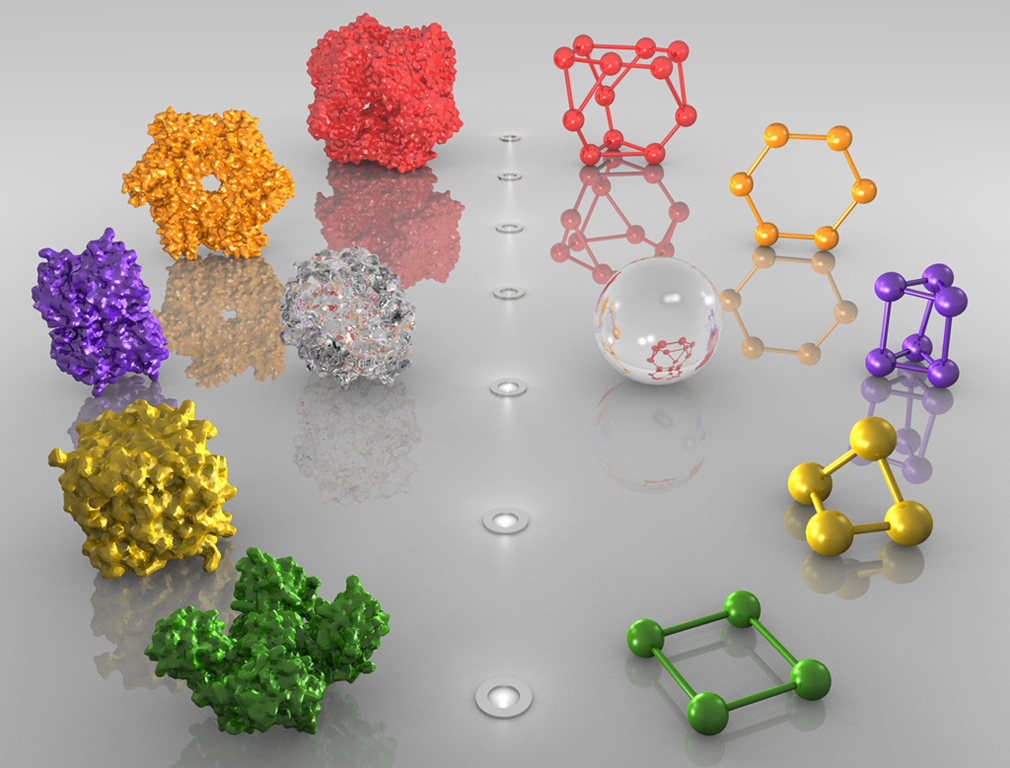
Emmanuel Levy Universite de Montreal, CANADA Fussy protein interactomes 1. A protein interaction network is spotlighted at the centre of the picture. The reflections of this network in surrounding mirrors symbolize the fuss that the ever-growing body of data on protein-protein interactions creates in the scientific community. 2. This image illustrates the graph representation of protein complexes that is used in the database 3DComplex (www.3dcomplex.org) to classify them and study them. On the left-hand side, the full atomic structures of protein complexes are shown, and their corresponding graphs are displayed on the right hand-side. 3. This image illustrates an evolutionary scenario for a homodimer. The homodimer, represented by gold beads, evolves a novel specificity to a protein represented by the orange square. The gene coding for the homodimer then duplicates, and leads to a dimer of paralogous proteins (gold and silver beads). Immediately after duplication, both proteins still bind to the same partner (orange square). However, after divergence, the silver protein looses its specificity towards the orange protein and binds the green polyhedron instead. This scenario of evolution is frequent, and in fact, has led to several important molecular machines such as photosystem I, which is shown in the image. |
  |
Ryan Lilien, Izhar Wallach, Aaron Hertzmann University of Toronto, CANADA Hot Art Capsaicin, a member of the vanilloid family, is best known for causing the sensation of heat experienced upon consumption of chilis. The sense of burning is caused when the small molecule binds the transient receptor potential cation channel, subfamily V, member 1 (TRPV1), a temperature sensitive ion channel typically active at 43 degrees Celsius. Binding of Capsaicin is thought to lower the TRPV1 activation temperature thereby inducing, at much lower temperature, the same signaling response caused by the application of physical heat. In addition to spicing your favorite dish, Capsaicin shows significant therapeutic potential. Capsaicin is used as an analgesic in topical ointments, may form the basis of a new class of antifungal compounds, is being investigated as a prophylaxis for type-1 diabetes, and shows promise in killing prostate cancer cells as well as those of certain leukemia. This image was automatically generated by an algorithm which simulates the brushstrokes of a human artist. Starting with a traditional space-fill model of Capsaicin, the algorithm generated strokes to follow the image contours. Strokes were laid down over an initially blank canvas with increasingly fine strokes placed in regions of high detail. The three dimensional paint model creates strokes that mimic an oil painting. A red-biased color scheme highlights the heat inherent to this amazing molecule. |
|
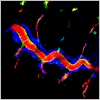
Eduard Korkotian Weizmann Institute of Science, ISRAEL Neuron - real and "thinking". It is a DsRed - transfected hippocampal cultured neuron (red) co-transfected with GFP-tagged GluR1 receptor (green). One can see some dendritic spine and shaft synapses containing GluR1 as well as long or short immature filopodia-like GluR1-free structures. On the cell fragment shown the dendritic tree is presented whereas the body of the cell is not seen. 3D image is generated using serial optical sections obtained with Zeiss confocal microscope from alive and "thinking" neuronal culture. | 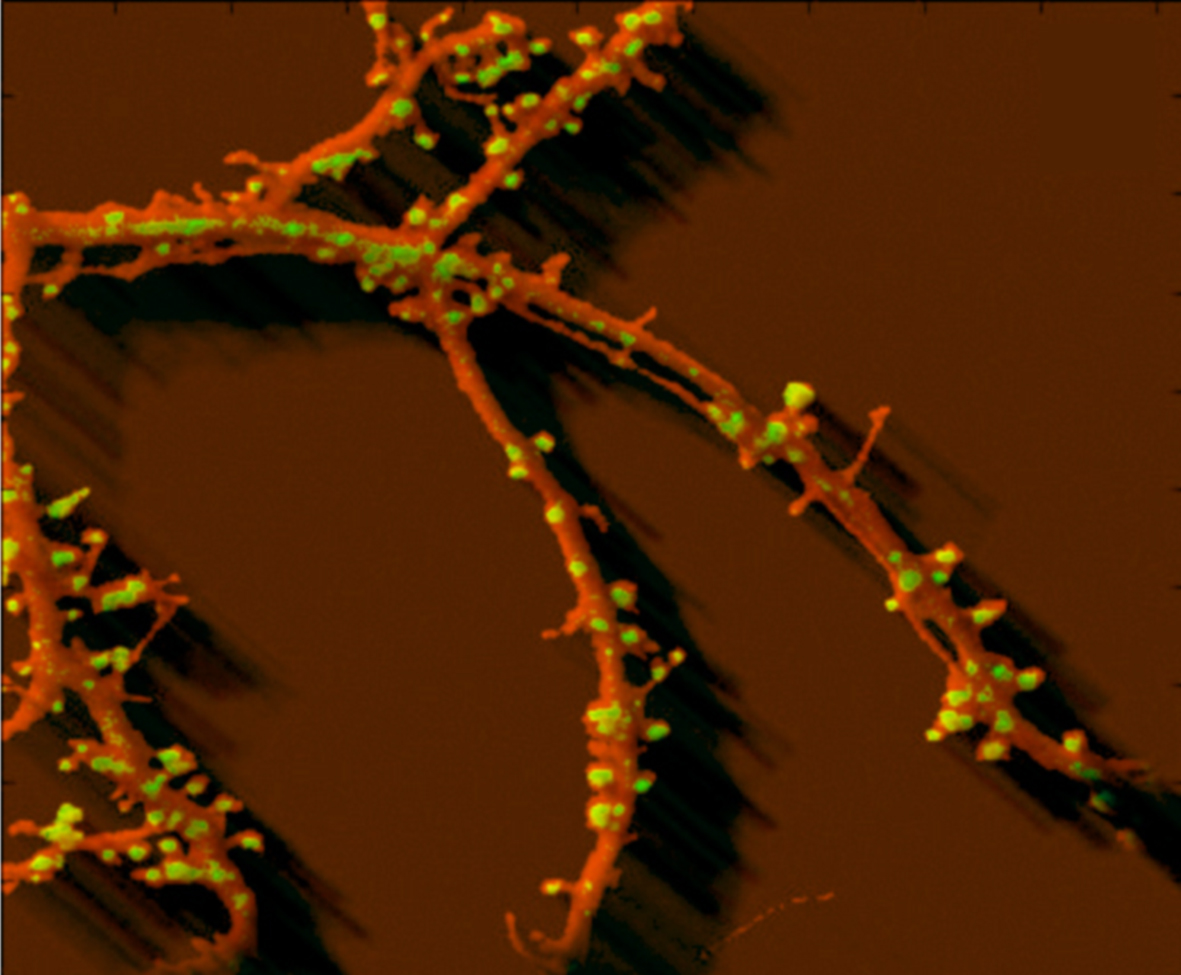 |
Monica Zoppè Scientific Visualization Unit - LTGM, ITALY PROTEIN EXPRESSIONS The video represents the two major aspects of our research: protein motion and visual representation. After the introductory scenes, the trip on the cell surface was obtained imposing properties derived from membrane biochemistry to several particles systems: single lipids, groups of lipids (rafts) and groups of proteins distributed on the surface. Once inside (after falling into the K channel) we meet apoCalmodulin, which, in the following scene, is hit by Calcium and transits to an open conformation. Protein movements are obtained using the Game Engine of Blender (an open source 3D animation and rendering program) according to a flow as follows: all atoms of the protein (about 2200, including hydrogens) are imported in two different positions separated by X frames (say 500). Atoms are connected with rigid body joints (chemical bonds). Blender Game engine interpolates between conformations evaluating joints and collisions. Other conformations from the NMR collection are inserted according to RMSD distance, to obtain a sequence of successive conformations. These are set in Blender at 50 frames distance, and again interpolated by the GE. Next, each frame is sent to biophysical programs that introduce some necessary minor adjustments to the position of atoms and calculate electric and lipophilic potentials for the protein. With a series of homemade scripts these are mapped on the molecular surface in that conformation. The surface properties were rendered using a specific texture for the lipophilic potential and emitting particles for electric potential. All our scripts and materials are available in open format. |
 Video Available 
|
Carlo Vittorio Cannistraci Politecnico di Torino, ITALY A Manifesto for a Cubism movement in Computational Biology, aka CBC¿ Broken up forms melt object parts by means of their divisions. The subject is simultaneously captured from a diaspora of viewpoints, in a centripetal movement which spreads it out. Surfaces intersecting at seemingly random angles censor a coherent sense of depth. The background and object planes interpenetrate one another to create the shallow ambiguous space. In the wake of Analytical Cubism, Computational Biology Cubism (CBC) yields biological images which are computationally "analyzed and processed" in order to convert natural forms into basic geometric shapes. Colors are almost absent, except for the use of monochromatic schemes. The emphasis on the color is transmigrated in an emphasis of the shapes by means of basic forms. Triangle and circle, and their three-dimensional relatives, are employed to represent the natural world. The artwork is obtained by mere computational tools applied on biological data, therefore it is by definition a computational biology result. The presented composition is a Delaunay-triangulation-based interpolation of protein spots isolated in a two-dimensional electrophoresis (2DE) gel map. The code for the algorithm, written in Matlab, was destroyed by file cancellation. Algorithm and parameter setting are not precisely retrievable in the mind of the author. The source spots represented in the artwork were randomly selected from the original 2DE map on a collection of about 4000 original spots. The probability of reproducing this artwork from the original data is estimated to be very close to zero. In conclusion I endorse it as an archetypal attempt and a first experiment in CBC. |
 |
John Pinney Imperial College London, UNITED KINGDOM Plan of attack: a map of HIV's interactions with the host cell. Interactions between HIV-1 proteins and the human cell form clear patterns in functional space. Here, each polygonal cell represents a single human protein, organized such that proteins with similar cellular locations lie close together in the map. Colored cells represent proteins that have been reported to interact in some way with one or more HIV proteins: red = Env; orange = Gag; yellow = Nef; light green = Pol; dark green = Rev; cyan = Tat; teal = Vif; purple = Vpr; magenta = Vpu; black = multiple viral proteins. By understanding more about the nature of host-virus interactions, researchers hope to design more effective treatments for HIV/AIDS. These may include novel drugs targeting host proteins instead of viral proteins, whose rapid evolution is the source of drug resistance (see Pinney J.W. et al. (2009) "HIV-host interactions: a map of viral perturbation of the host system", AIDS 23:549–554). |
 |
Kristian Rother IIMCB Warsaw, GERMANY Twenty Characters The image "Twenty Characters" proposes a novel and more intuitive way to notate protein sequences, inspired from Chinese calligraphy. The characters of the Chinese language emerged from pictographs to abstract shapes, integrating semantic, phonetic and aesthetic content in a highly condensed form. This process was simulated by the so-called Hanzi Transformation, a method capable of converting any picture into the context of Asian calligraphy. Using this method, abstract figures of persons, objects, and protein structures have been created, approximating the Chinese character form while still retaining the pictographic information. Consequently applying the Hanzi Transformation method to biomolecules, The chemical structures of the amino acids were used to construct a set of 20 characters as an alternative one-letter-code. All important properties, like charges, aromaticity and sidechain size are represented in the symbols. Therefore, this character set allows perceiving similarity on a chemical level more directly than the Latin characters commonly used. The font created here is aimed to circumvent limitations in human perception that are an obstacle in finding information in multiple protein sequence alignments. | 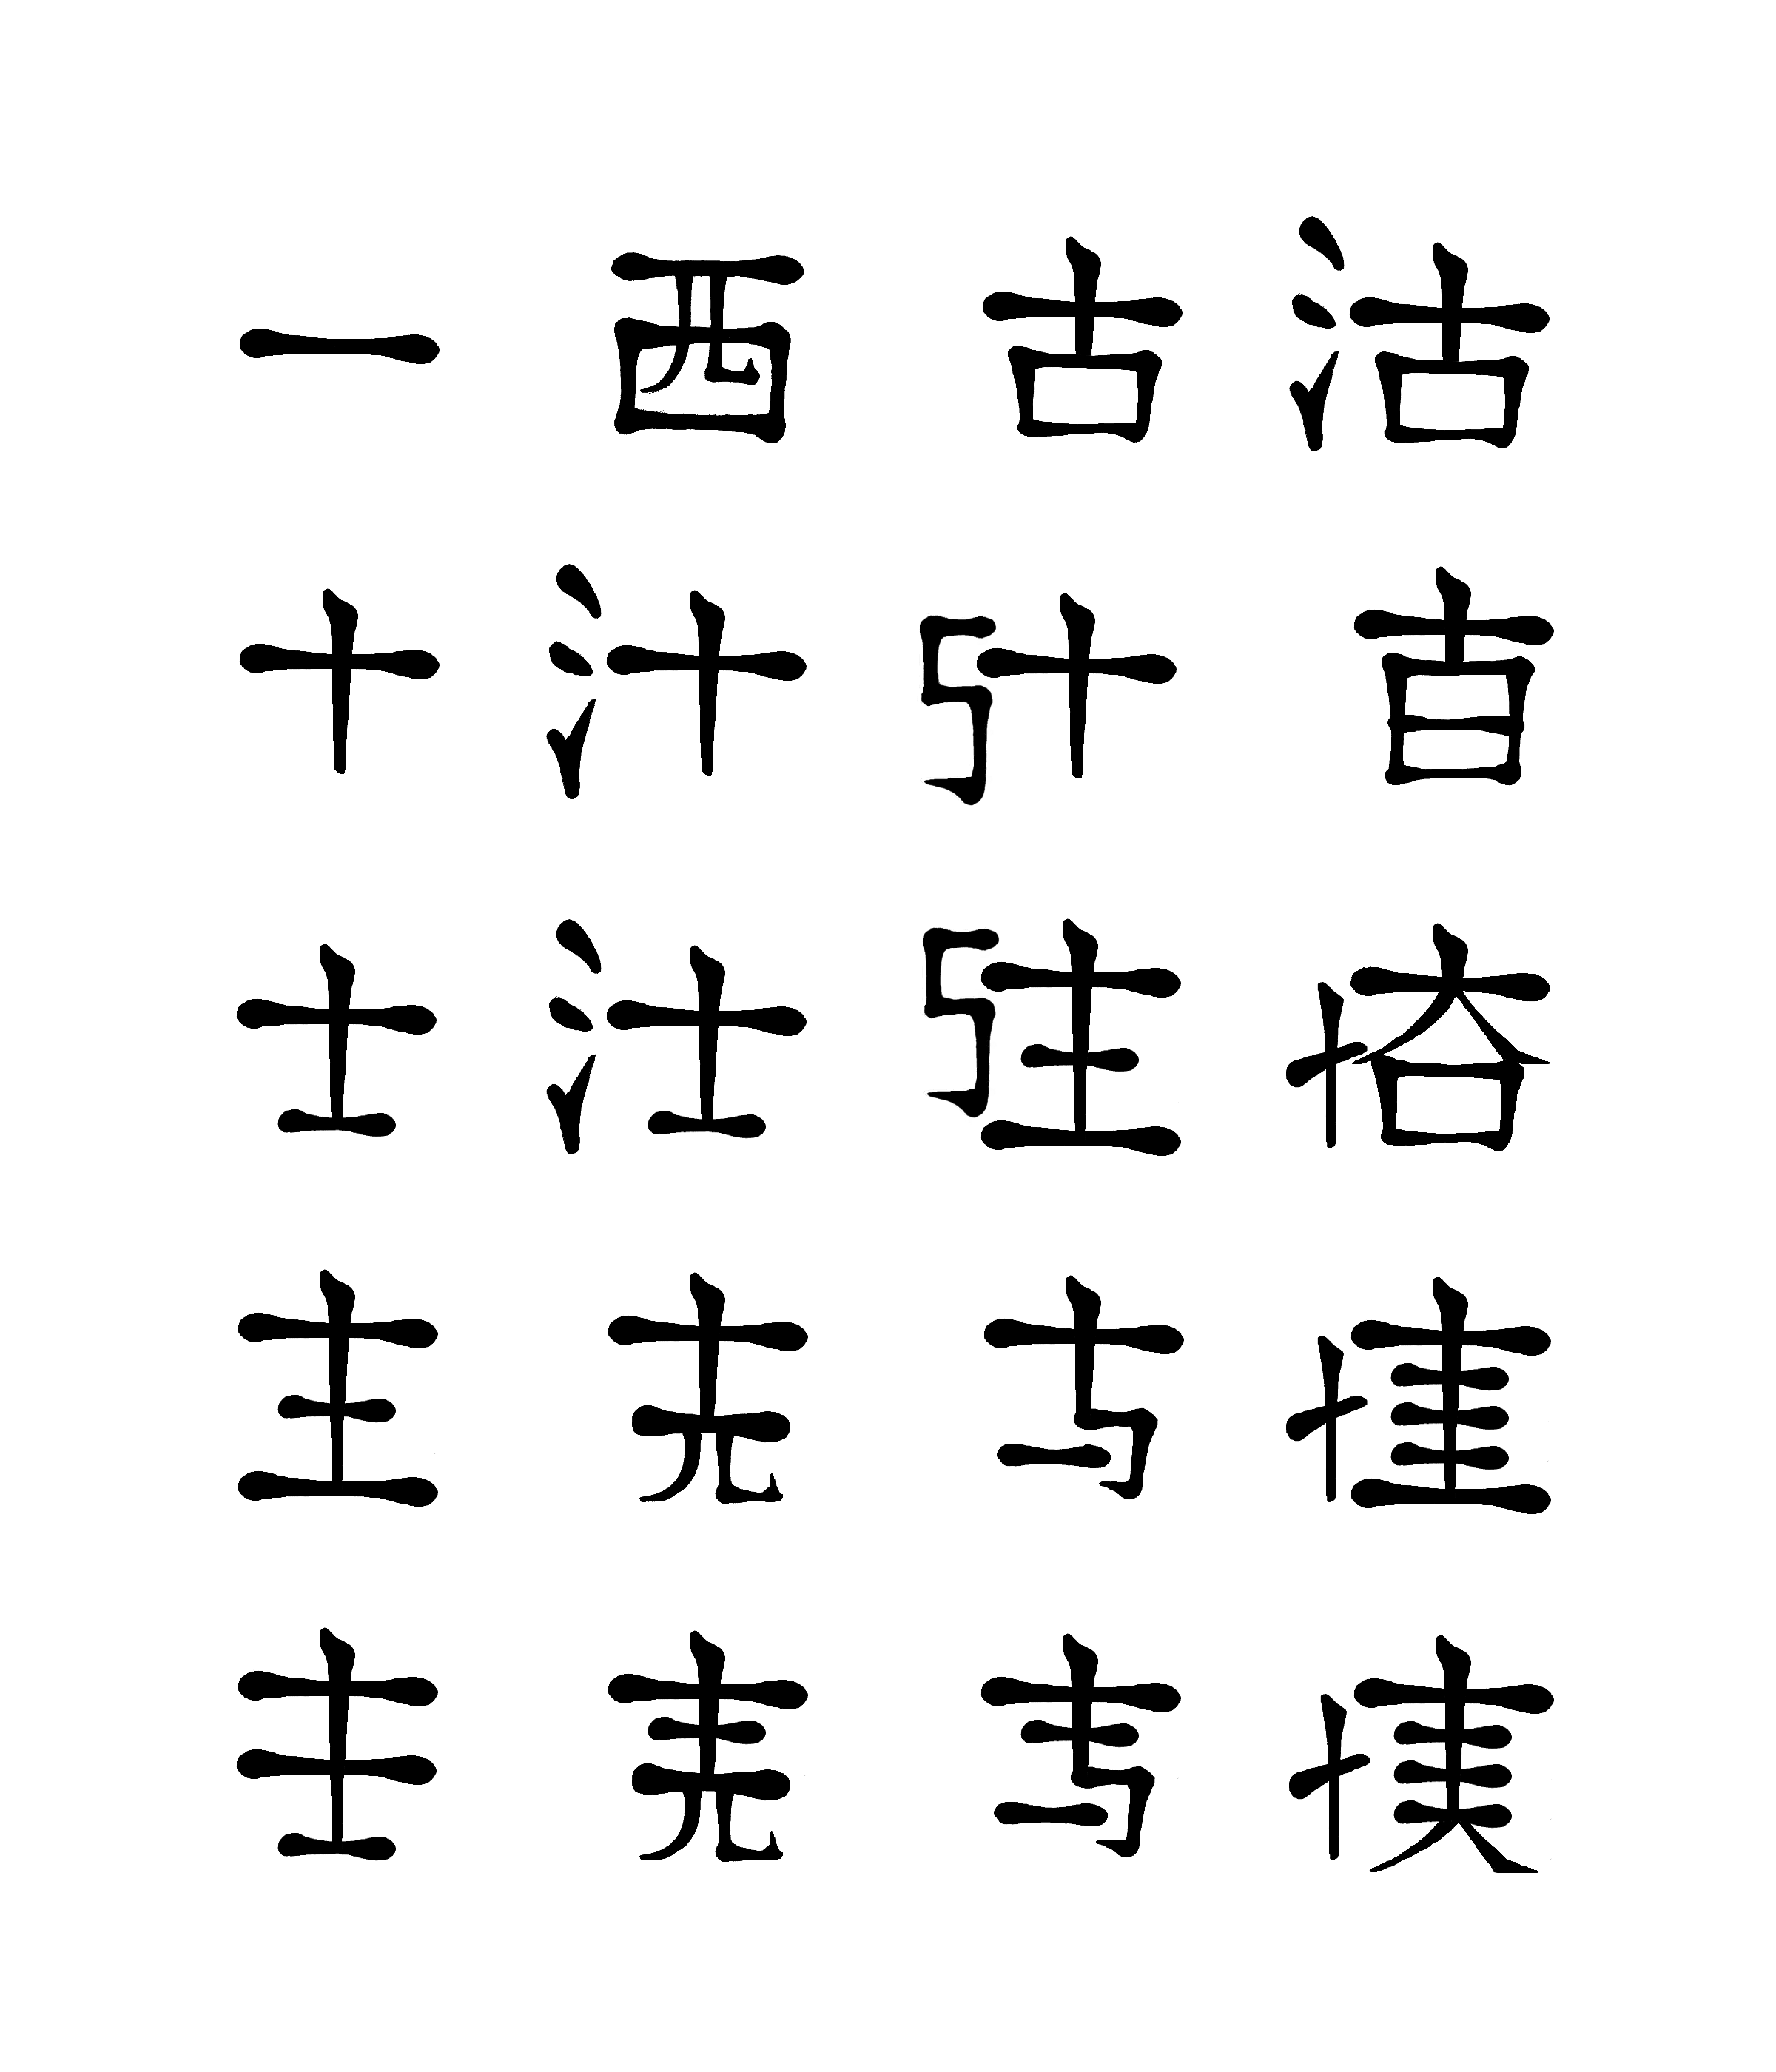 |
Timothy Nugent University College London , UNITED KINGDOM Darwin in Protein Space This image is based on a photograph of Charles Darwin by Julia Margaret. It is changed into a 1.2 gigapixel mosaic using images of protein structures from the Protein Data Bank (PDB), generated from X-ray crystallography and nuclear magnetic resonance data. The mosaic is composed of image tiles from a pool of about 19000 non-identical PDB structures and so represents the current content of the entire PDB. To produce the image, a mosaic generator Metapixel was used. It attempts to use each image tile at least once. | 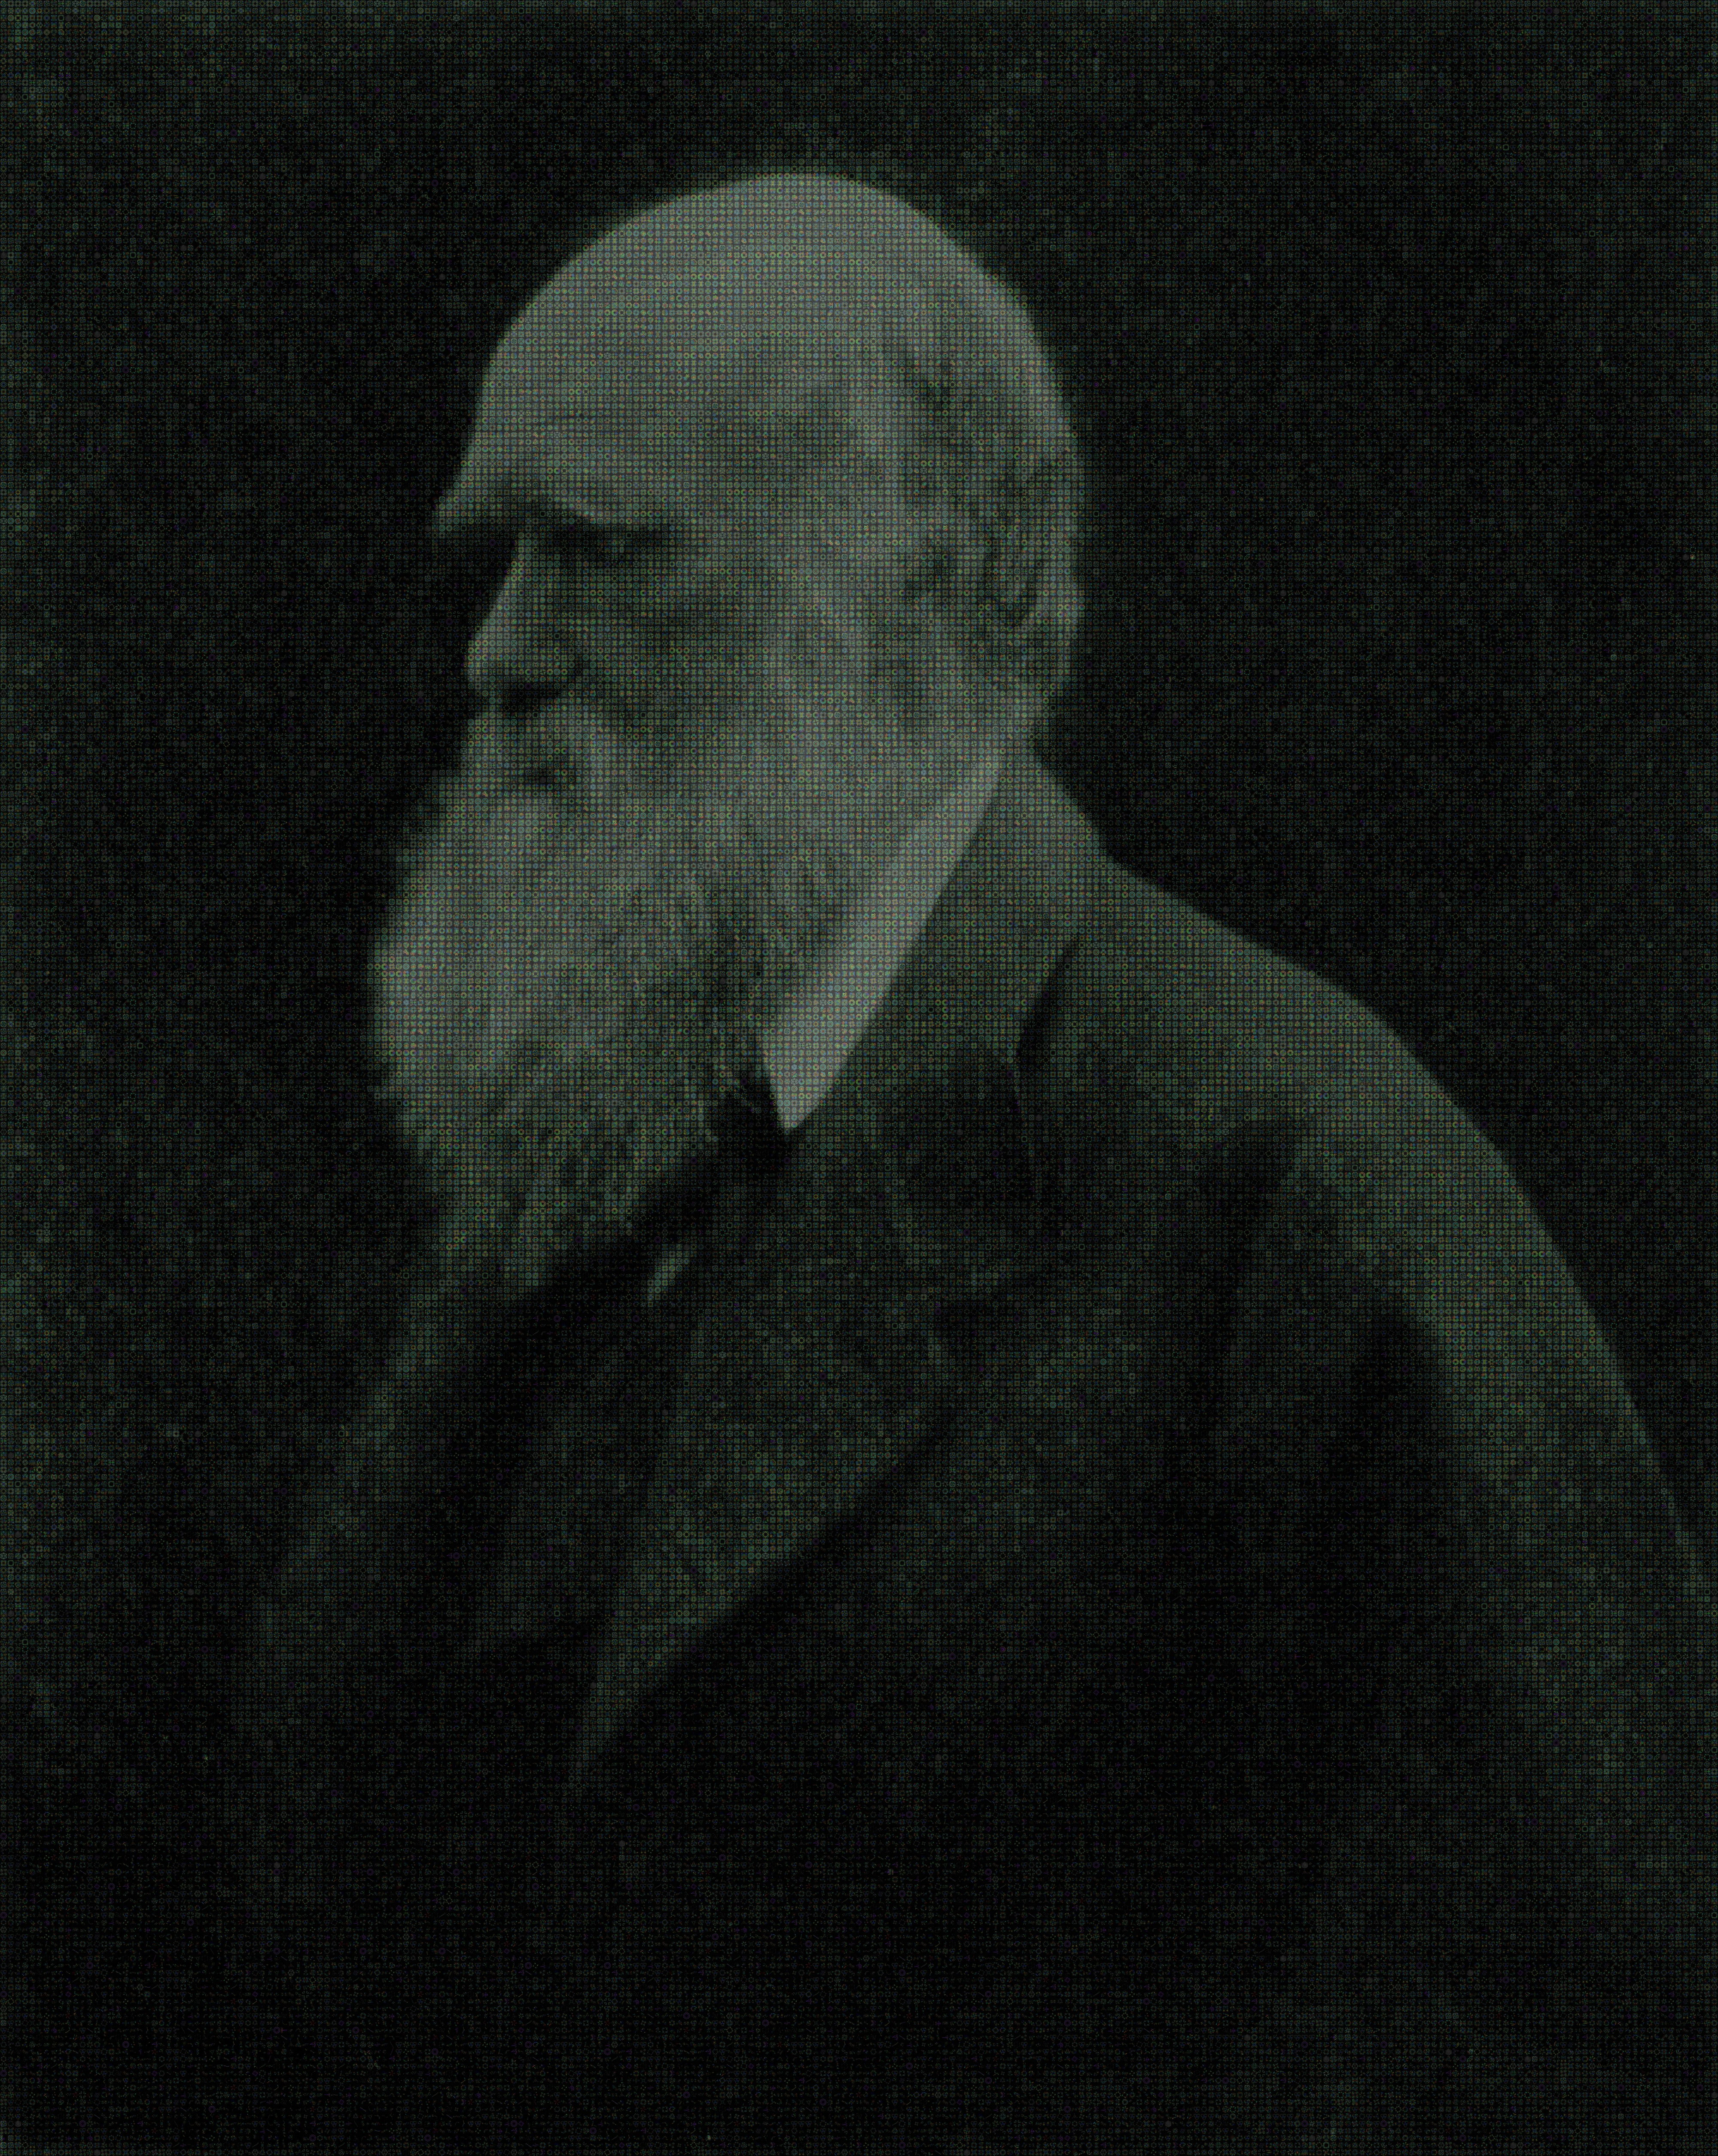 |
Nils Gehlenborg European Bioinformatics Institute, UNITED KINGDOM TF 1295x5372 The image shows Space Maps for the expression levels of 1,295 transcripts encoding human transcription factors across 5,372 samples. The Space Maps visualization technique represents expression profiles as 2-dimensional glyphs that are generated by mapping the expression levels onto a Hilbert curve. The glyphs are arranged in two-dimensional space to convey information about relationships between the expression profiles. In the image the glyphs are arranged according to alphabetical order of the corresponding gene names. | 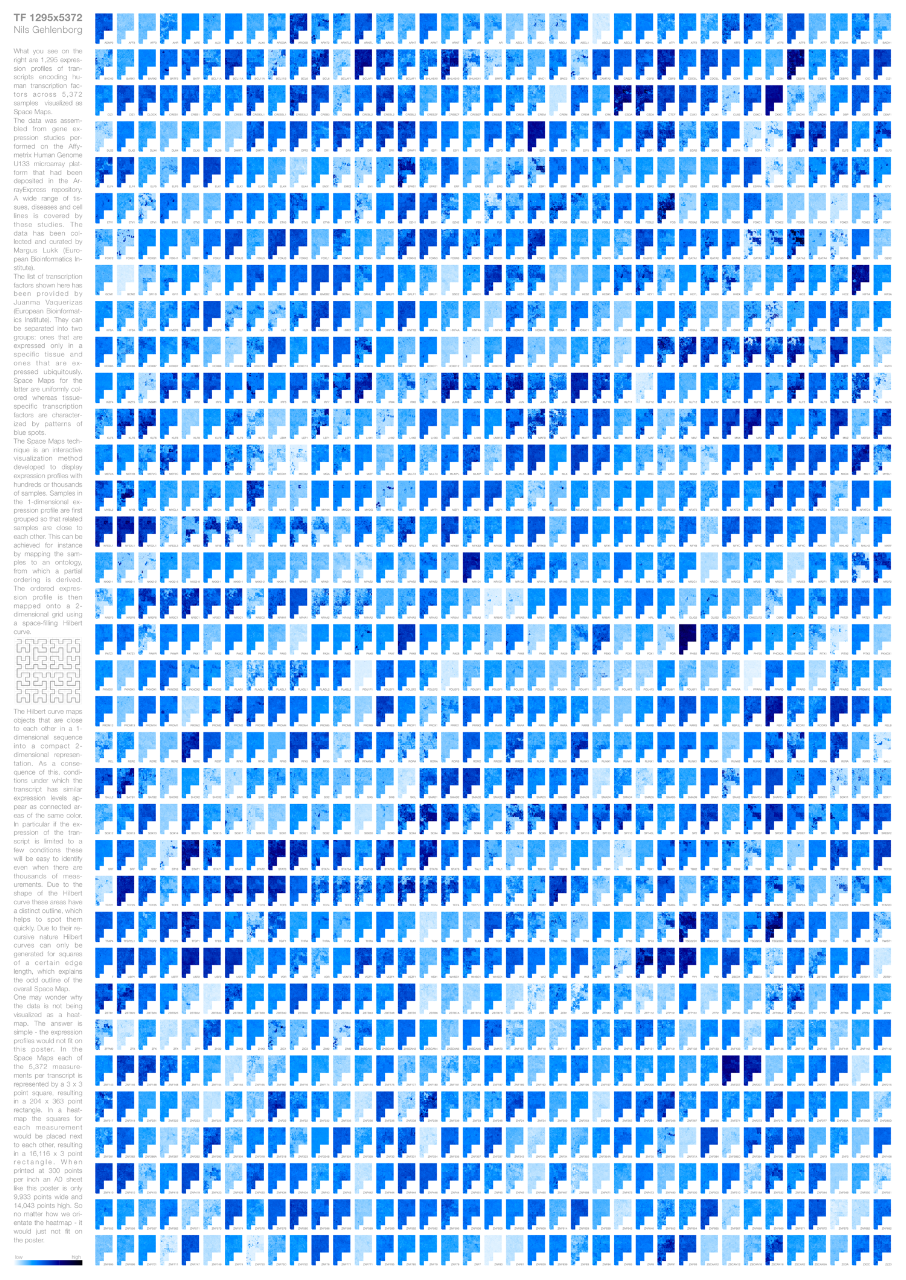 |
Rafael Ördög PIT Group, ELTE, HUNGARY Delaunay decomposition of a protein Delaunay decompositions are widely used in combinatorial geometry and in the field of geometrical algorithms for examining properties of spatial point sets. Structural databases - like the PDB - provide the possibility of exploiting the mathematical apparatus developed for examining Delaunay decompositions. During our latest research we found this approach pretty useful. Moreover, to help the evaluation of results we created a PyMOL plugin - PyDeT - that is able to visualize Delaunay decompositions. | 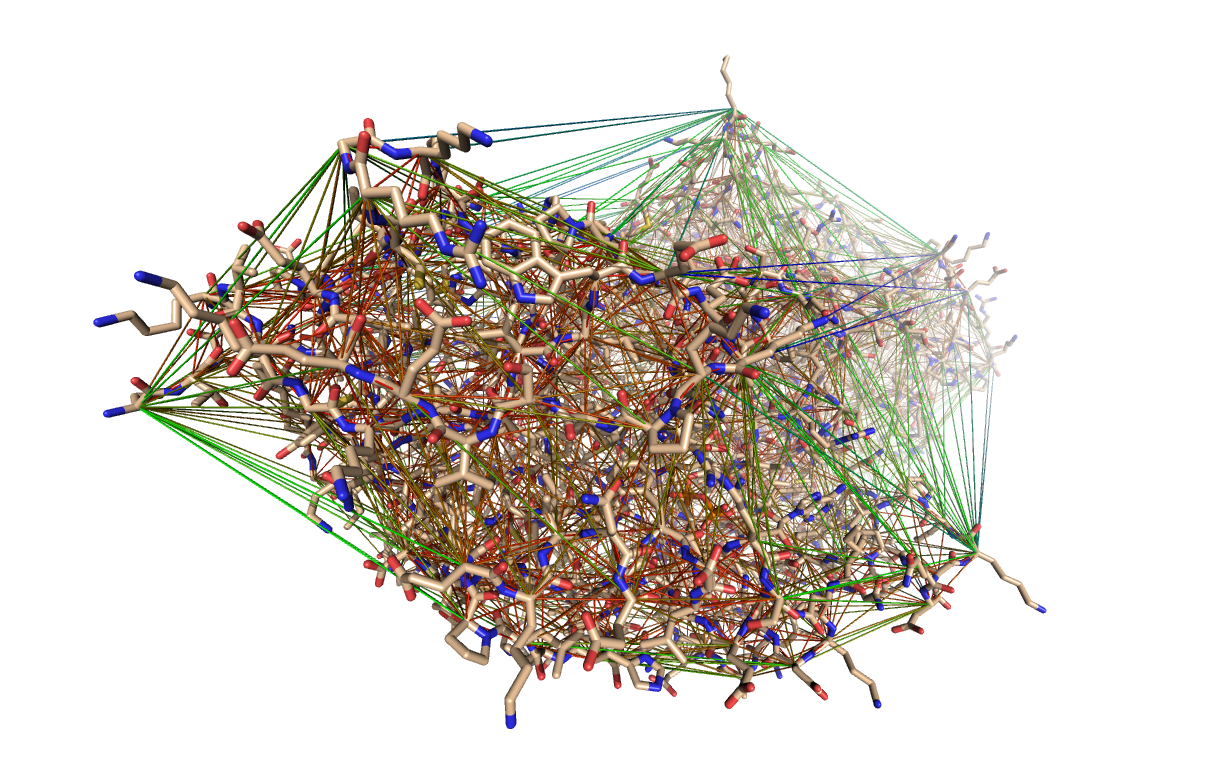 |
Christos Ouzounis King's College London, UNITED KINGDOM Net of Life Despite recent advances in publishing standards, the fundamental unit of scientific publication is sill a self-contained manuscript. Scientific data generation, collection, analysis and visualization have all improved through many technological advances, while the communication medium of results to peers and the general public has remained essentially unchanged, which limits the ways in which science is propagated and disseminated. In our own experience, we have struggled to communicate a fairly complex piece of research in comparative genomics to our peers and the public. The original manuscript describes the Net of Life - the intricate network of horizontal and vertical gene flow patterns across the microbial world. To present the main results to our peers, students and the general public in an aesthetically more engaging way, we created a science communication video—the result of a collaboration between are search group and a digital media company. | File Available |
Marion Reuter Fraunhofer Gesellschaft, GERMANY Zebrafish goes gaudy Development stages can be easily monitored at Zebrafish embryos. The chorion is transparent and after 48h they already start hatching. For toxicological tests desired or detrimental effects can be detected by machine learning tools, which use grey scale values to distinguish the areas of an egg. But to visualise them for the human eye colours are far better. So here 48 hours old zebrafish embryos with magnification 50 show what is only black and white for the software. |
 |
Daniel Banky Eotvos University, HUNGARY The integrated metabolic and predicted physical enzyme-enzyme interaction network of the Mycobacterium tuberculosis In this image we show the integrated metabolic and originated physical enzyme-enzyme interaction network of the Mycobacterium tuberculosis. We created them separately and then integrated it into a single network. Nodes are the enzymes catalyzing reactions, the red directed edges are the metabolic pathway and the blue undirected edges are predicted physical interactions. | 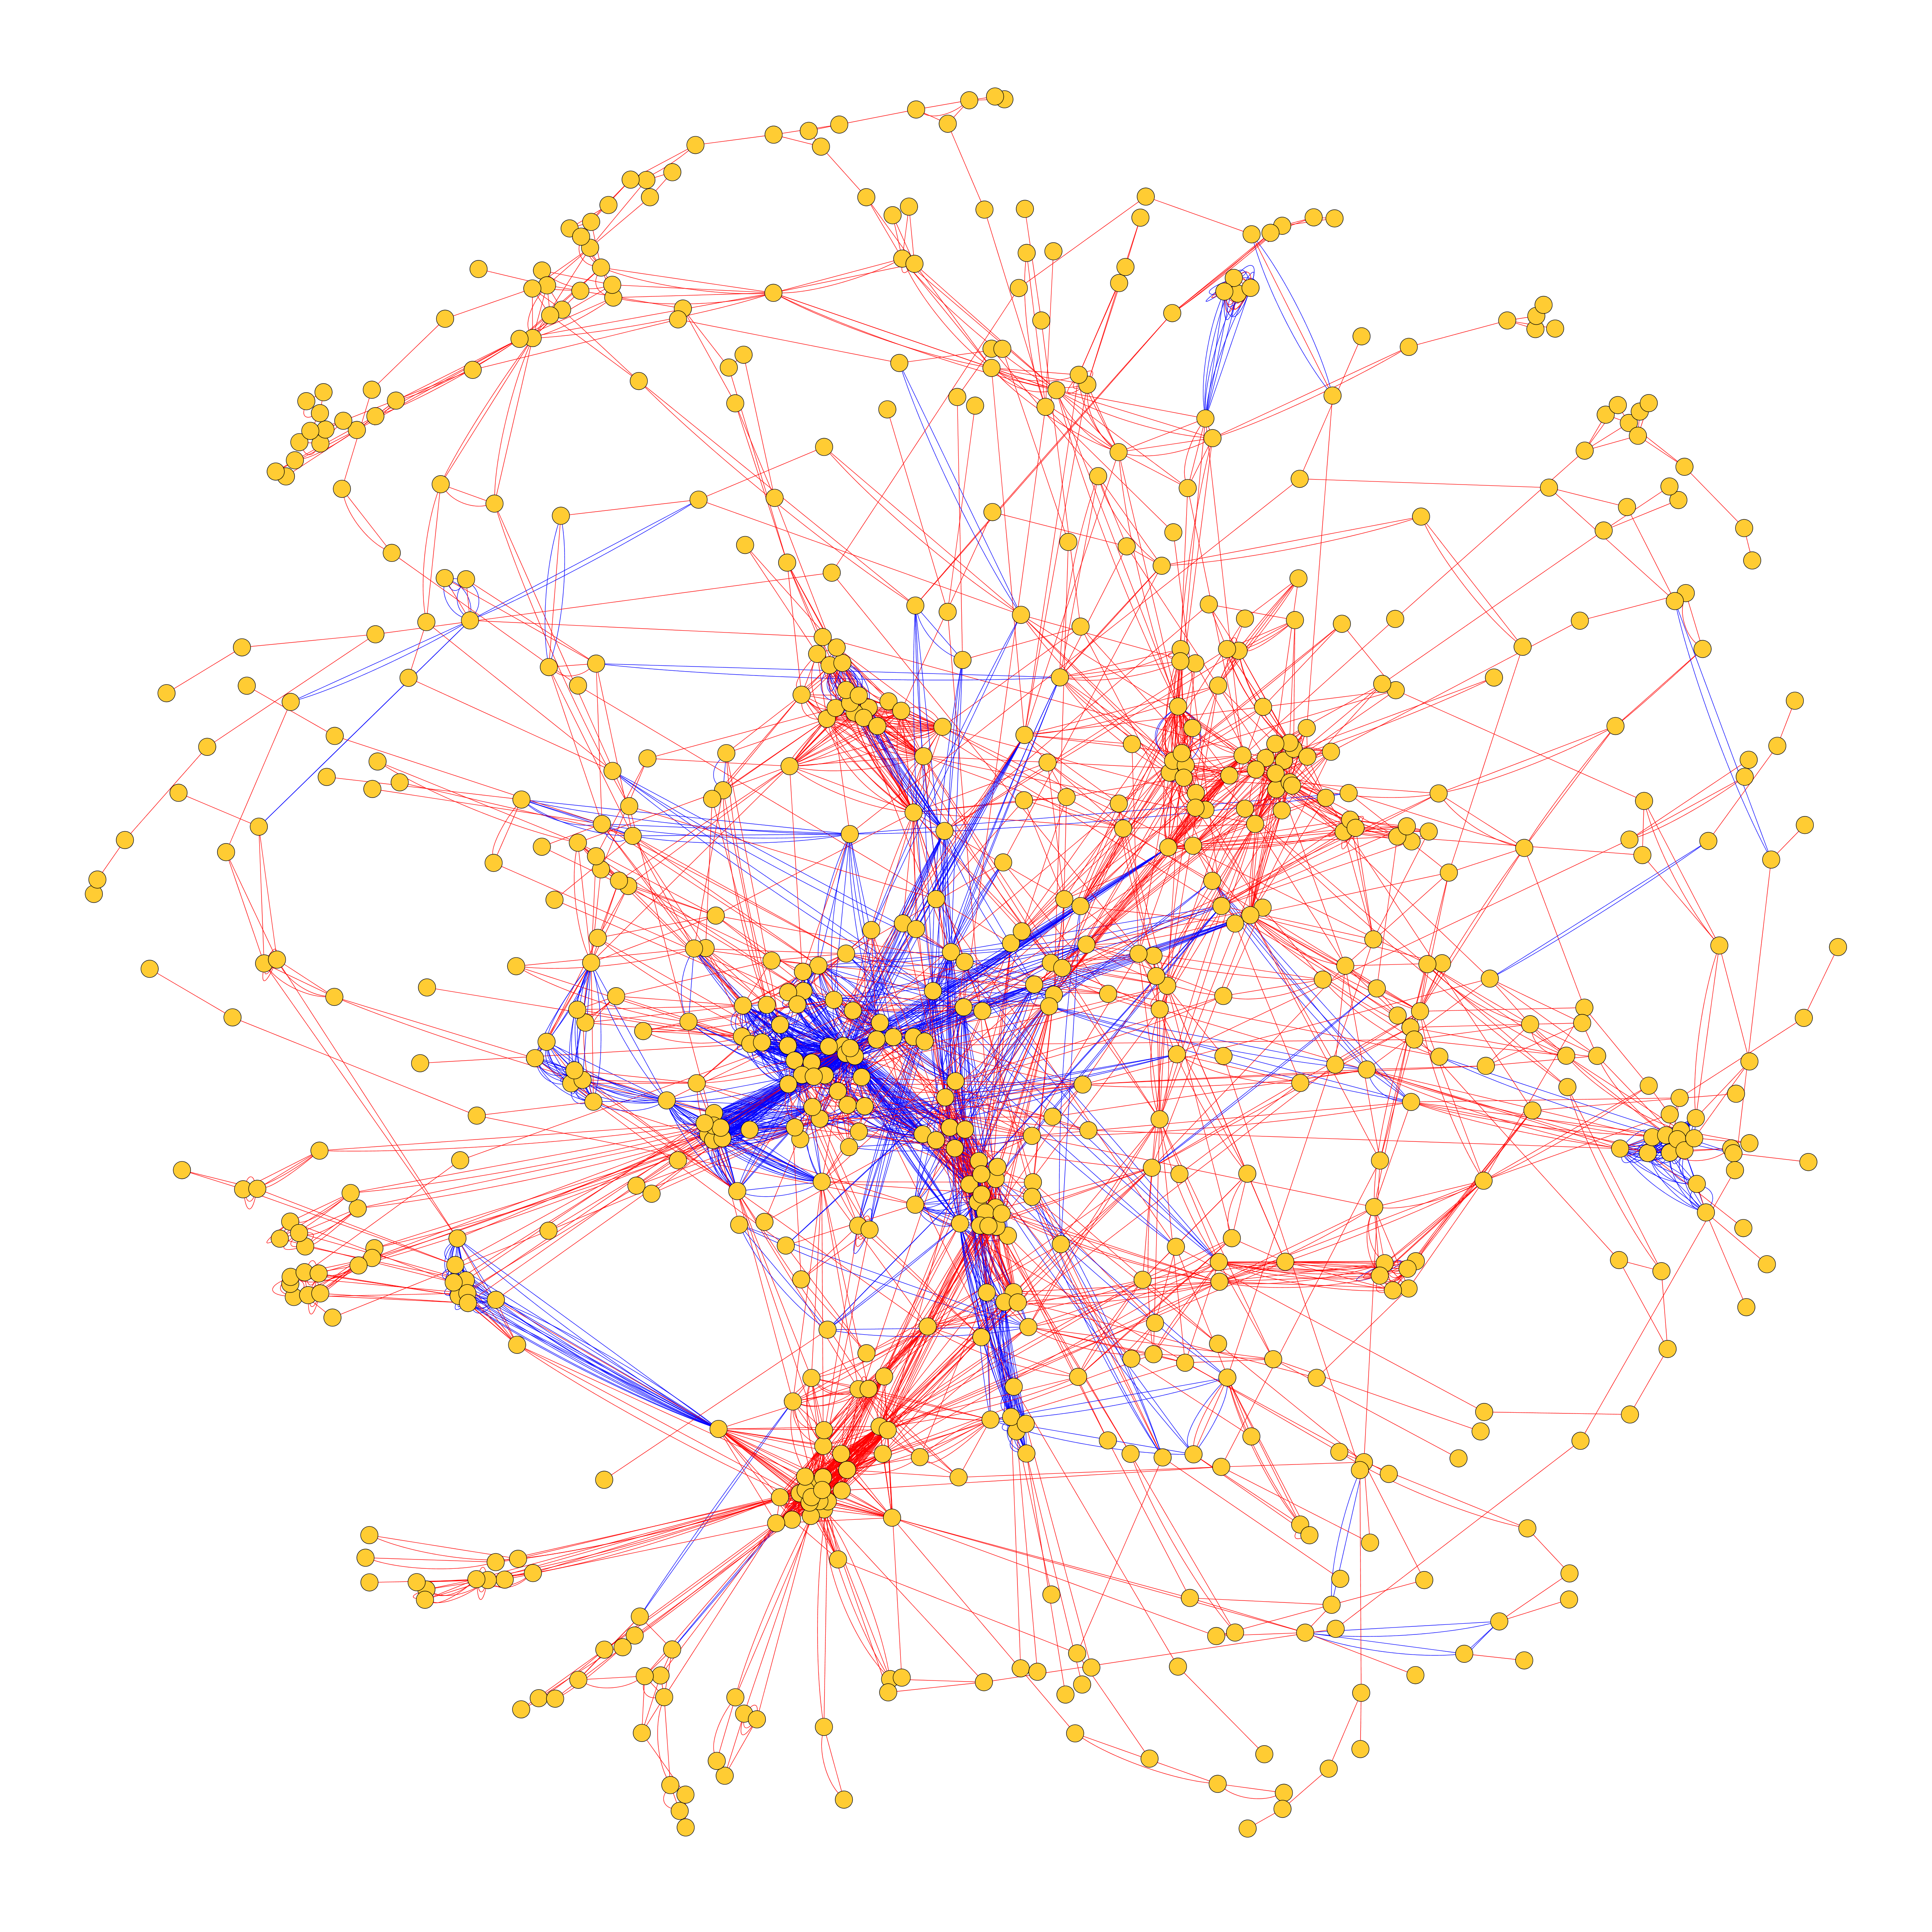 |
Jason McDermott Pacific Northwest National Laboratory, UNITED STATES Cyanothece Diurnal Wreath This is a representation of the transcriptome of the cyanobacterium Cyanothece sp. ATCC 51146 under 12 hour light/dark cycles. In this network each node is a gene and the edges between nodes are statistical associations between expression profiles. A simple graph layout algorithm was applied to the network producing the "wreath" that is like the face of a clock. Expression levels at 7AM (1 hour of light) are shown with highest expression being red and lowest being blue. Biological processes arrange themselves on the wreath according to the correct environmental conditions (light or dark) that they require.This wreath network is beautiful in itself but also is a powerful visualization of a complex system in action. The biological insight that can be derived from the wreath produces a representation that blends intuitive power with biological meaning. This produces a piece of art that's beauty is inexorably linked with its meaning. The cyclic nature of the diurnal system is revealed by a simple analysis of the data. The complicated is rendered understandable by all. |
|
Annika Kreuchwig Leibniz Institut fuer molekulare Pharmakologie, GERMANY Live is movement: Dynamic processes in receptor-related signal transduction G-protein coupled receptors (GPCRs) are membrane-spanning proteins and they are encoded by 3-4% of the human genome. Induced by diverse ligands (e.g. peptides, ions, light, hormones), they transduce extracellular signals into the cells by conformational changes. GPCRs are of high physiological importance since dysfunctions can cause diseases and it has been estimated that GPCRs represent over 40% of current drug targets. Thus, the molecular understanding of the transduction mechanism is of high interest. Few three-dimensional structures of GPCRs like rhodopsin and the adenosine receptor were crystallized since 2001. All of them are non-active conformations, but the first active structure was recently solved. The two static conformations now provide the opportunity to simulate structural changes as a dynamic process between both non-active towards activated conformations. In the video sequence the potential dynamic activation process of the thyrotropin receptor (TSHR) in the transmembrane region followed by intracellular activation of a G-protein is visualized. Since the structure of the TSHR is not solved yet, homology models of the non-active and activated conformation were constructed. Activation of the receptor induces a reorientation of amino acid side-chains and a relative movement of the transmembrane helices to each other. Active as well as non-active conformations are locked by specific residue interactions. Intracellularly the receptor possesses structural patterns to recognize heterotrimeric G-proteins. Coupling and activation of the G-protein (release of GDP and binding of GTP, not shown) leads to dissociation of the alpha-subunit from the beta/gamma-subunits. The subunits interact with different effectors in the cell. | Video Available |
Kunihiro Nishimura The University of Tokyo, JAPAN Visualization of Prokaryote Genome Data: genoDive Pro genoDive Pro is a novel viewer for prokaryote genome. It designed as a three-dimensional interactive genome viewer. It also designed genome data in order to visualize locus, amino acids, and annotations. The concepts of genoDive Pro are 1) beautiful graphics, 2) Advanced interfaces, and 3) Simple user interfaces. In terms of genome data, genoDive Pro works as a DAS (Distributed Annotation System) client. It can load genome data simultaneously from DAS 1.5 compliant servers. It can also import various annotations on the browser. genoDive Pro visualizes them as a browser. It provides us an interactivity fully to browse the data. In terms of information visualization; it allows seamless and semantic zooming from whole view (chromosome level) to detailed view (sequence level). It is easy to understand relationships among the data. genoDive Pro takes importance on user’s utilization. You can browse and interact with the data intuitively; you can drag mouse, then you can browse the data (move, zoom-in and zoom out). It also has many useful functions. One example is a “gene tour” function that provides us an automatic tour of various locuses. You can see some family genes as a sequence of scene. It also has a bookmark function that you can mark the place. It can also import various kinds of annotations, such as expression data. These data are visualized as a color and luminance. genoDive Pro is written in C and OpenGL and runs on multiple platforms (Windows/Linux/ Mac OSX). | Video Available |
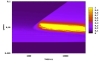
Aurelien Rizk INRIA, FRANCE Hills and valleys in the functionality landscape of a biological system. This landscape in kinetic parameter space is obtained by evaluating on numerical simulations of a deterministic model of the system a given temporal specification. The functionality measure evaluates from 0 to 1 the conformity of the observed behavior to the expected behavior (temporal specification written in temporal logic LTL). The yellow region corresponds to full functionality whereas darker regions represent lower conformity with the specification. |
 |
Gabor Ivan PhD Student, HUNGARY 3D Visualization of the metabolic network in Mycobacterium tuberculosis One kind of Protein-Protein Interaction (PPI) networks are metabolic interaction networks. Formally, this kind of network is a graph, with nodes as (metabolic) reactions and edges as reactants travelling between them. Examining the metabolic network of an organism may provide insight to the main biological processes of the organism - this kind of insight may be obtained (for instance) by performing graph algorithms on the metabolic ineraction network. Graph algorithms to take into account include graph clustering, PageRank calculation, finding minimal cuts etc. In this video we show the metabolic interaction network of Mycobacterium tuberculosis. Data for constructing the graph has been collected from the KEGG database; some additional data for the appropriate inclusion of the mycolic acid pathway has been collected from further articles. The graph's position in the three dimensional space has been determined using the "pajek" software. This position determination is carried out by imagining the graph as if the nodes were connected by springs (with the same spring constant for each edge) and then determining the energy minimum for this arrangement. This way, densely connected parts of the graph will form small, compact structures in 3D space, thus becoming directly visible. | Video Available |