Art and Science Exhibition
ISMB 2010 brings together scientists from a wide range of disciplines, including biology, medicine, computer science, mathematics and statistics. In these fields people are constantly dealing with information in visual form: from microscope images and photographs of gels to scatter plots, network graphs and phylogenetic trees, structural formulae and protein models to flow diagrams; visual aids for problem-solving are omnipresent. Some of the works of the first such exhibition at the ISMB 2008 in Toronto combine outstanding beauty and aesthetics with deep insight that perfectly proves the validity of our approach or goes beyond the problem's solution. Others were surprising and inspiring through the transition from science to art, opening our eyes and minds to reflect on the work that we are undertaking.
The Art & Science Exhibition 2010 presents the artworks that have been generated as part of research projects. They are also soliciting images resulting from creative efforts that involve scientific concepts or employ scientific tools and methods.
Art & Science Images |
Anna Lewis
University of Oxford, UNITED KINGDOM
Nick Jones, University of Oxford, UK
Mason Porter, University of Oxford, UK
Charlotte Deane, University of Oxford, UK
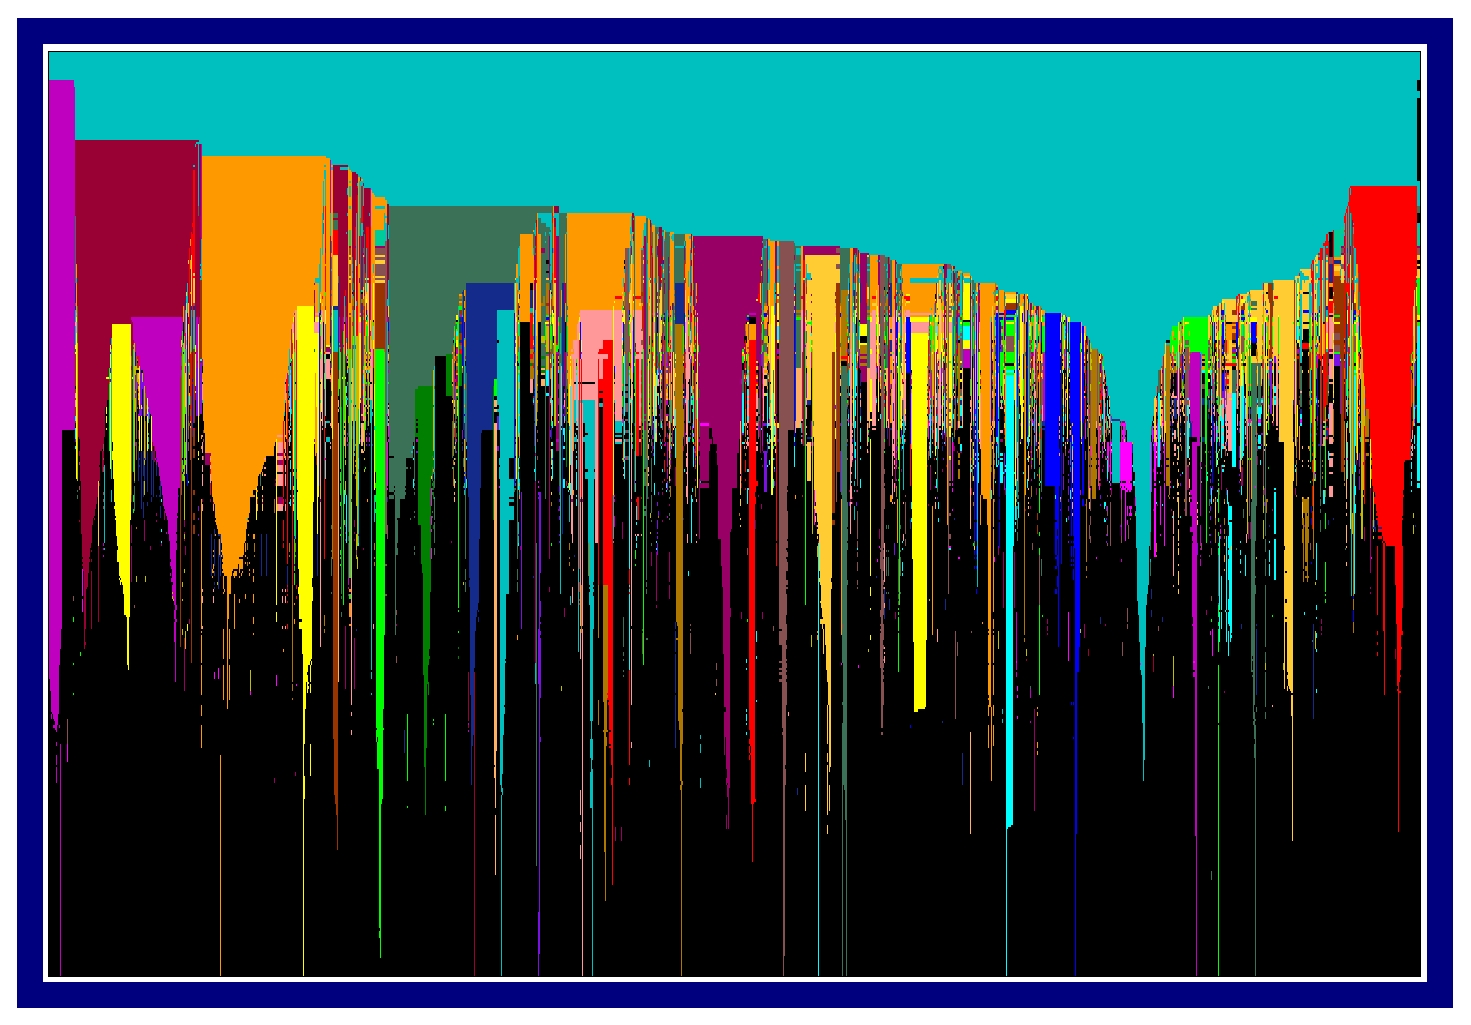
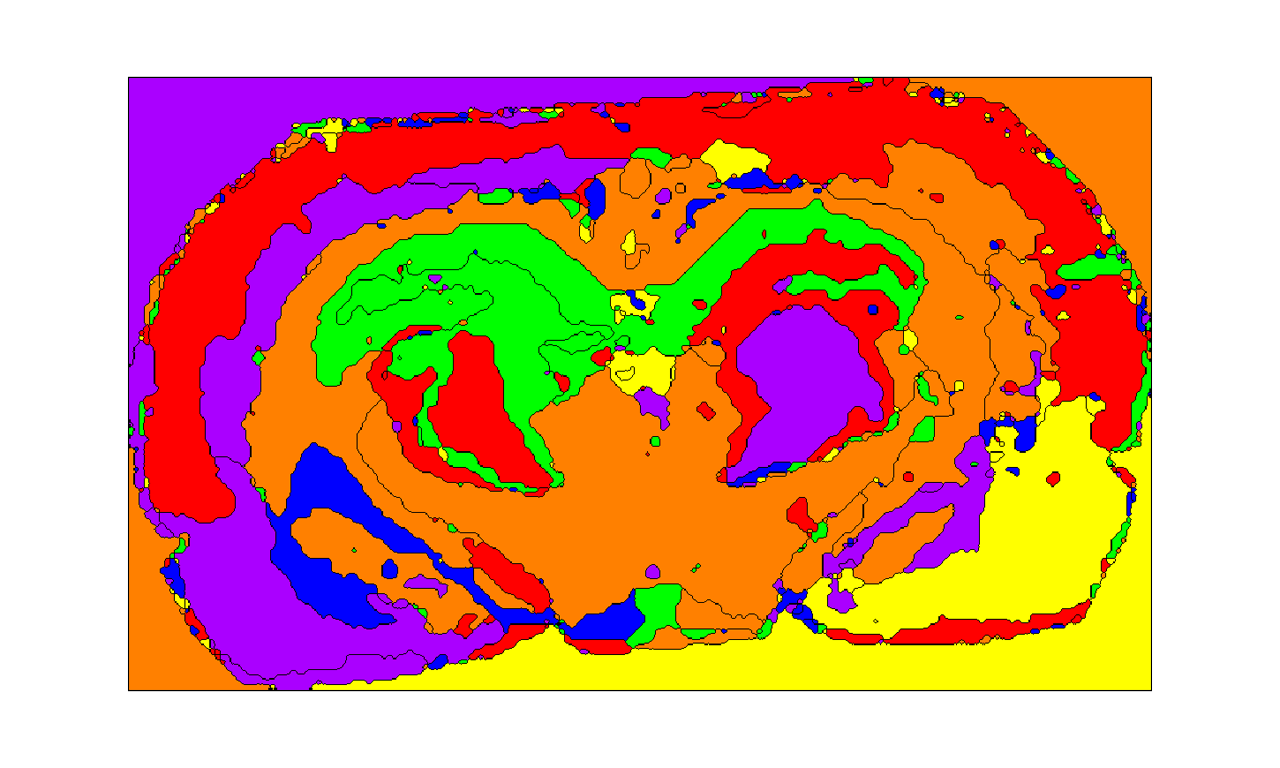
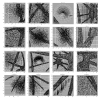
Multi-scale community structure of the yeast protein interaction network
Groups of proteins that are much more densely connected to each other than the rest of the protein interaction network, termed communities, are candidates for biological modules.
Here we visualise communities at multiple scales within the yeast protein interaction network. If you imagine viewing a network at arms reach, you are unable to resolve much structure (top of the image). But as you bring it closer, structure becomes apparent: you start to see a few large communities. (Closer distances are towards the bottom of the image). As you bring it yet closer, these in turn split up into smaller communities, and so on.
A horizontal slice of this image gives a network partition at a particular scale. A vertical slice gives the community membership of a particular protein at multiple scales. Blocks of colour are particularly highly interconnected parts of the network. Communities below a certain size are coloured black. |
 |
Kazuharu Arakawa
Institute for Advanced Biosciences, Keio University, JAPAN
Kazuki Oshita, Institute for Advanced Biosciences, Keio University, JP
Masaru Tomita, Institute for Advanced Biosciences, Keio University, JP
Chaos Game Representation
Genomic sequences exhibit characteristic nucleotide composition bias, especially in the relative abundances of short oligonucleotides. While diverse dinucleotide frequencies are observed among various phyla, closely related species tend to display similar compositions. Through these studies, the relative abundances of dinucleotides are considered to be the "genomic signature". Chaos Game Representation (CGR) was first proposed by Jeffrey as a scale-independent means to visualize this non-randomness of genomic sequences, by applying the concept of chaotic dynamical systems. Further studies by Almeida et al. has shown that CGR is a generalized Markov chain probability table which can accommodate non-integer orders, and that CGR is advantageous over Markov transition tables for its computational efficiency and scale-independence. In order to fully utilize the scale-independent properties of CGR, we developed a web server for generating zoomable CGR images utilizing Google Maps API. The web server is freely accessible at http://www.g-language.org/wiki/cgr/. |
 |
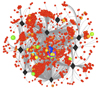
Magali Michaut
University of Toronto, CANADA
I love networks
This picture represents a genetic interaction network in the budding yeast [1]. Nodes represent genes and edges show genetic interactions between them (red for negative, green for positive). The network has been created using Cytoscape [2]. Only a few nodes have been moved manually. It shows that the author is happy to work on biological networks. If you look in more details you will find another message...
[1] Costanzo et al., The genetic landscape of a cell, Science 2010 Jan 22 327 (5964):425-31
[2] Shannon P, Markiel A, Ozier O, Baliga NS, Wang JT, et al. Cytoscape: a software environment for integrated models of biomolecular interaction networks. Genome Res. 2003;13:2498–2504 |
 |
Jenn Parnell
Towson University, UNITED STATES
Sublime Affliction
Sublime Affliction is a series of wearable amuletic objects that use the visual vocabulary of cellular pathology. The work is designed to address the psychological and physical aspects of illness and the coping mechanisms for diagnosis. The pieces that comprise Sublime Affliction are designed to be worn over the site of illness and reference disease through decorative patterning and material choices. Each work has a tactile and amuletic quality that come from the process based creation of the work as well as the placement on the body. |
 |
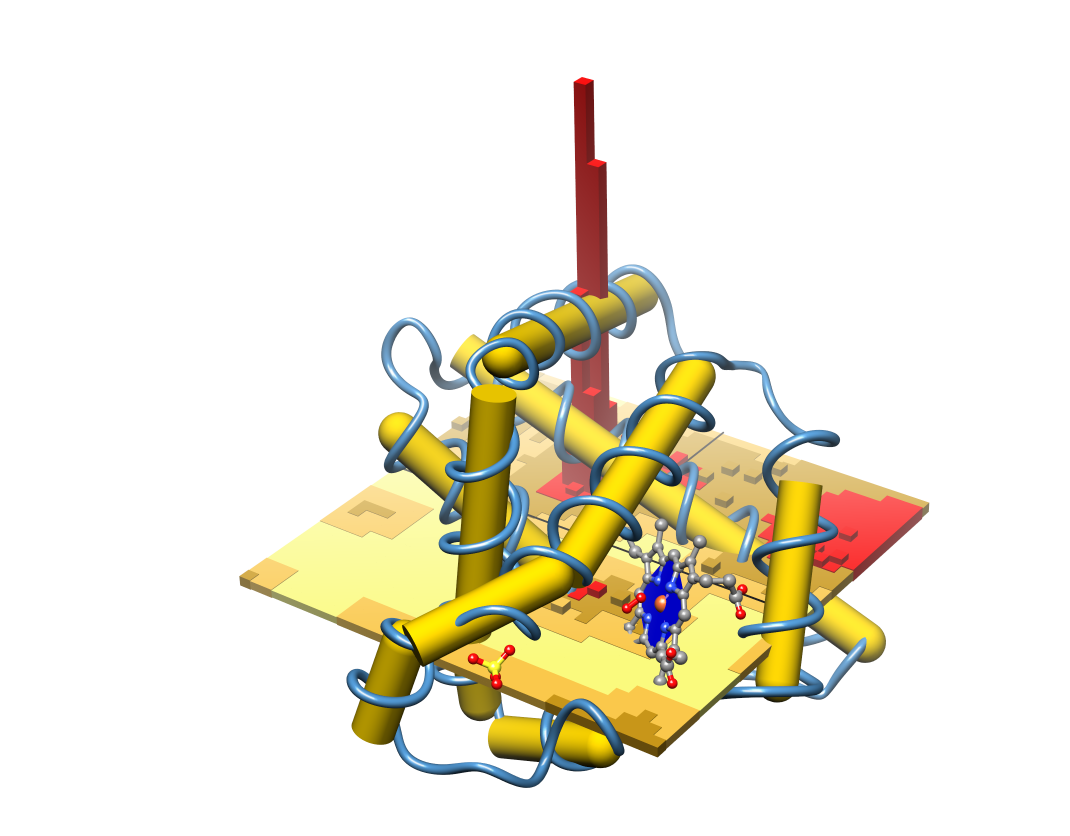
Forbes Burkowski
University of Waterloo, CANADA
Rendezvous with Ramachandran
This image was created using a Python script in conjunction with UCSF Chimera. It is a "mashup" of a least squares plane (embedded in the atoms of the heme ring), tubes representing the inertial axes within the helices, and a 3D representation of the Ramachandran plot. The protein is oxymyoglobin (PDB ID = 1MBO). The title is an homage to "Rendezvous with Rama" by Arthur C. Clarke. |
 |
Andrzej Brodzik
MITRE, UNITED STATES
Eigen-faces of Goroka
The Island of Papua is divided between the Indonesian province of West Papua (formerly Iryan Jaya) and the independent state of Papua New Guinea. Papua is the second largest island in the world. It is also one of the most remote and one of the most culturally, anthropologically and linguistically diverse places on Earth, with over 800 indigenous languages being spoken. Some of this diversity can be observed at many sing-sings, or tribal gatherings. The images included here are from the Goroka Show held in September 2009 in the village of Goroka. |
File Available |
Yuval Itan
UCL, UNITED KINGDOM
Mark Thomas, UCL, UK
Joachim Burger, Johannes Gutenberg-University, DE
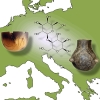
Map of Europe showing a lactose molecule, Linearbandkeramik pottery, and the inferred origin location of lactase persistence/dairying coevolution.
Lactase persistence, the genetic trait that enables adult humans to digest the milk sugar lactose, is thought to have coevolved with the culturally transmitted practice of dairying. In this work the we used computer simulations, conditioned on archaeological and genetic data, to infer that this coevolution process began about 7,500 years ago in a region between the northern Balkans and Central Europe, probably in association with the Neolithic Linearbandkeramik culture. |
 |
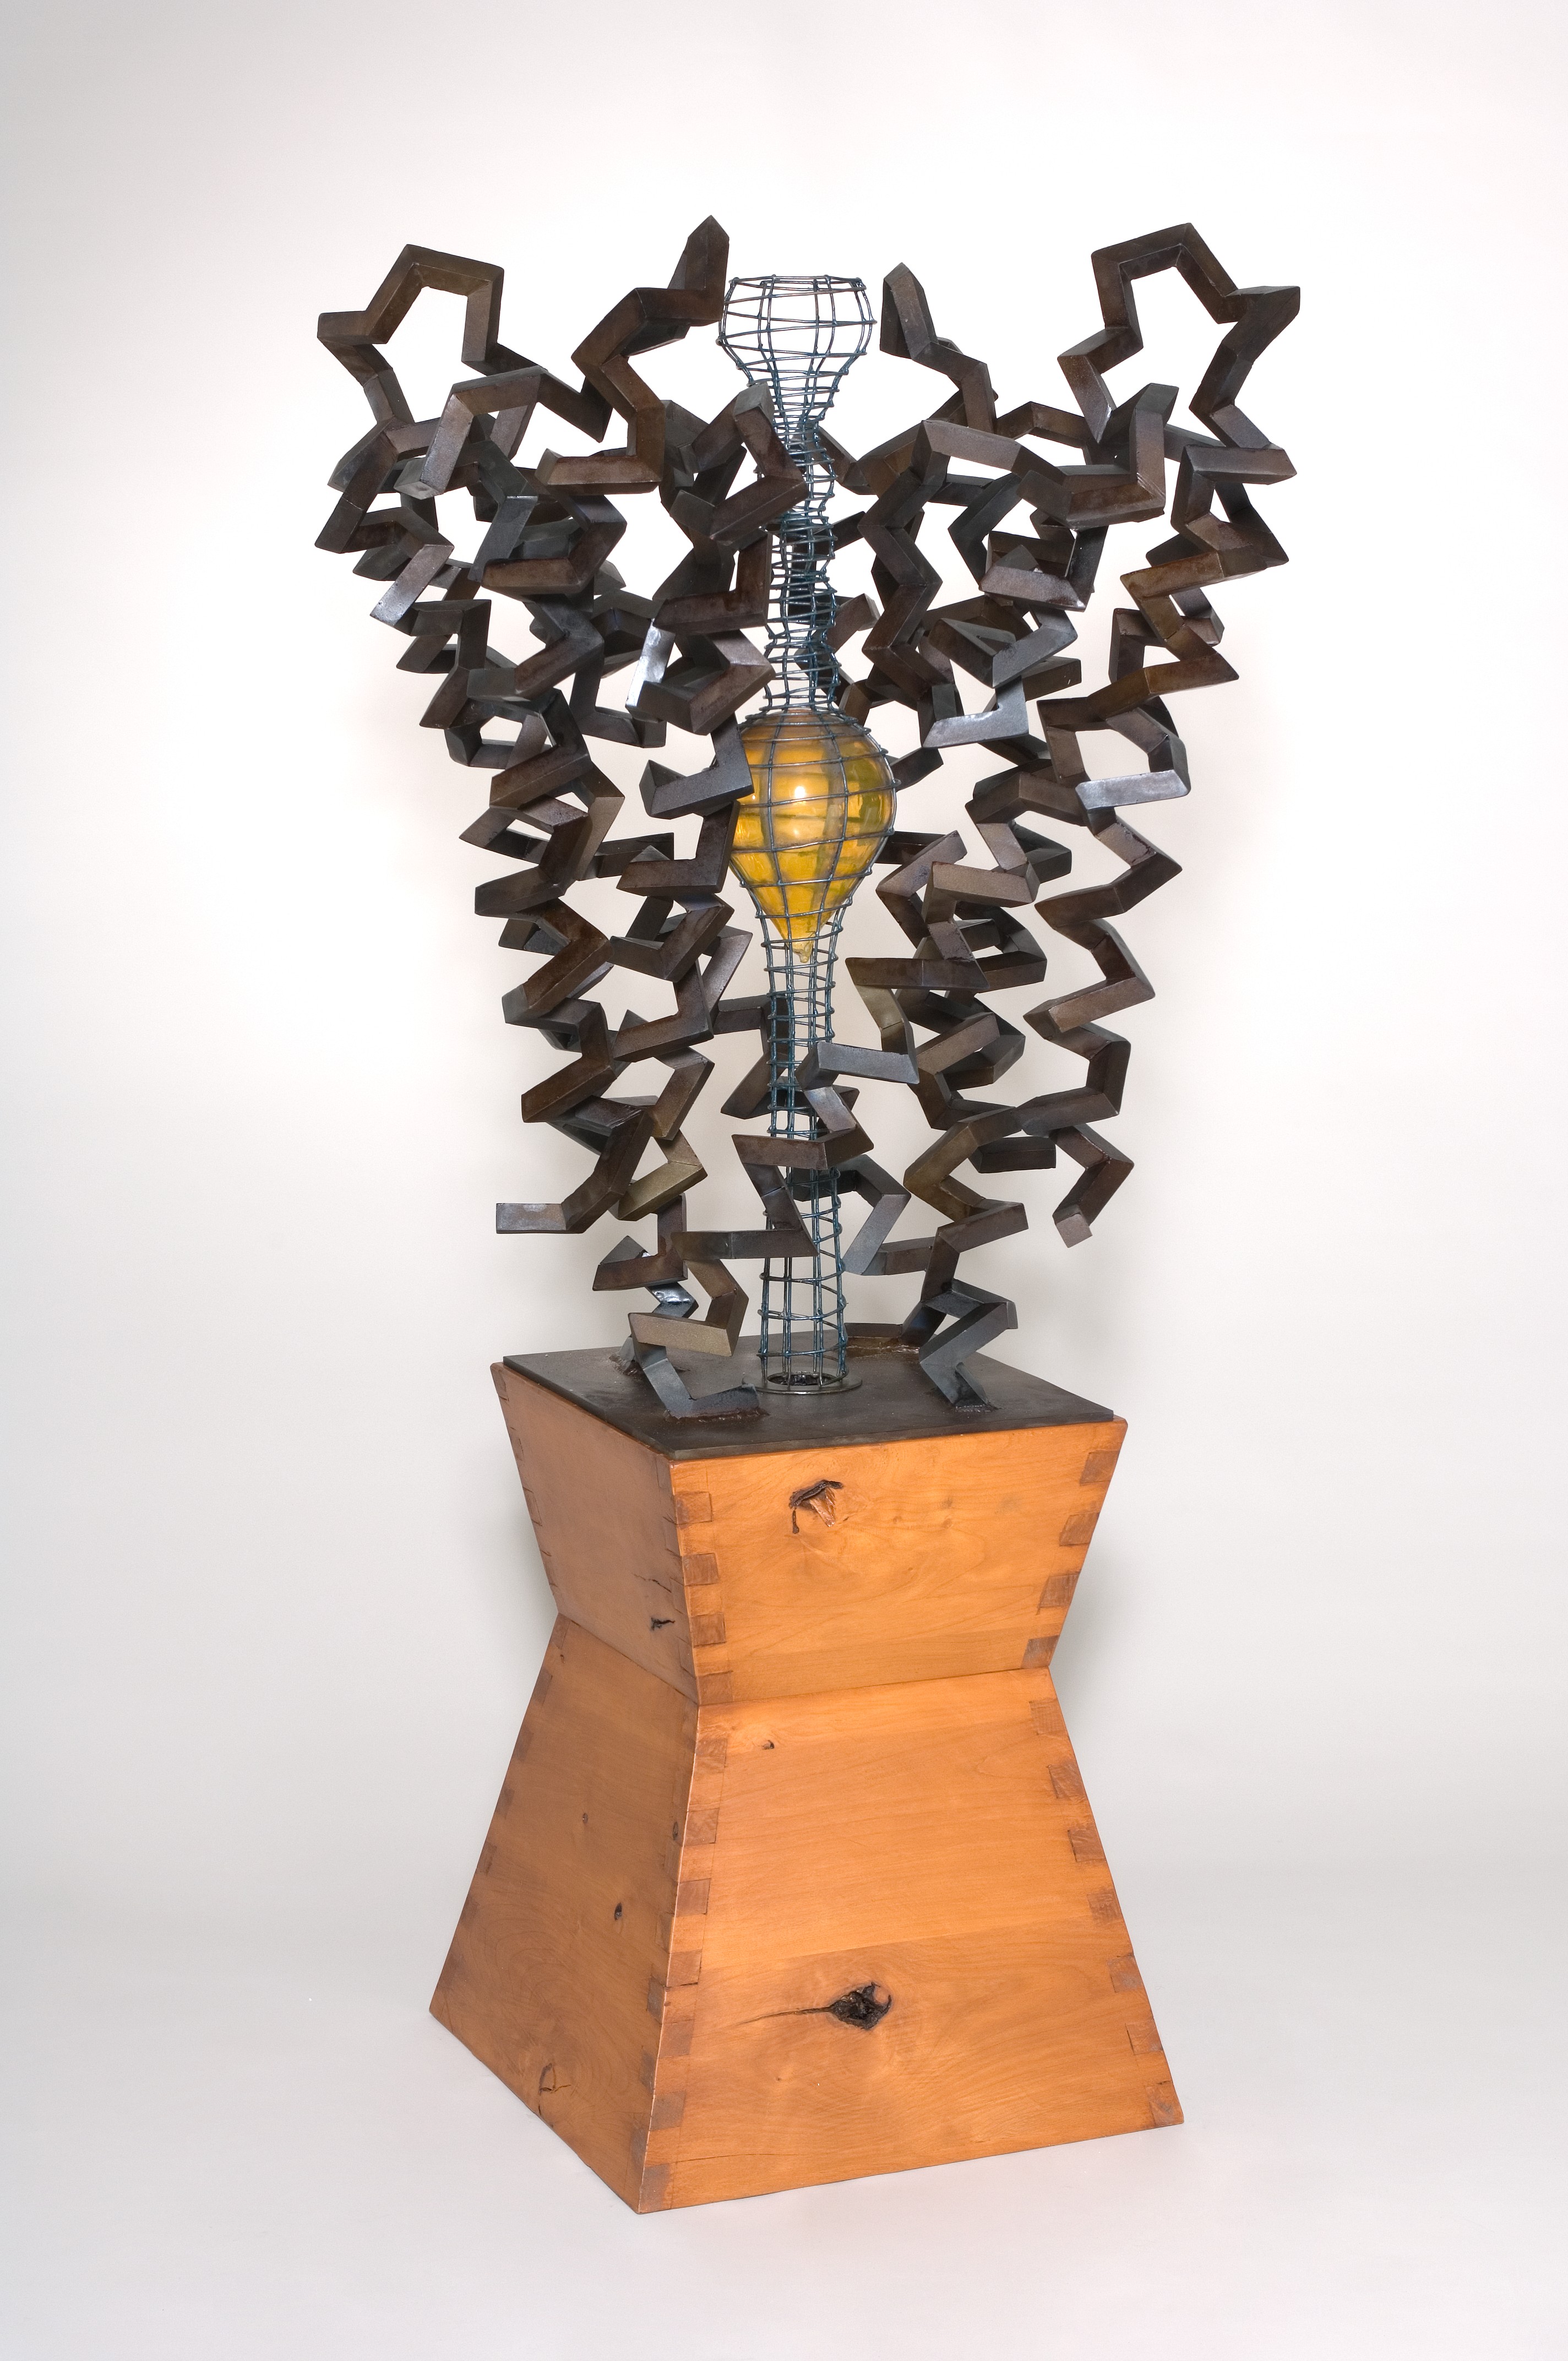
Julian Voss-Andreae
Scripps Institute, GERMANY
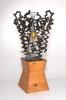
Mr
KcsA 2007
This sculpture based on the structure of the potassium channel protein was commissioned by Roderick MacKinnon, who won the 2003 Nobel Prize in chemistry for his discovery of this structure. Ion channels are of deep significance to us since they form the tiny pores in our nerve cells that let charged atoms go through to ensure that the cells 'recharge' in order to fire repeatedly, which is the process at the basis of all our intellectual and emotional responses to the world and our creative powers.
Birth of an Idea, 2007
Photographer: Dan Kvitka
Steel, glass, and wood, 60" x 32" x 32" (1.50 m x 0.80 m x 0.80 m)
Location: Rockefeller University, New York City, NY |
 |
Jonathan Dickerson
University of Manchester, UNITED KINGDOM
David Robertson, University of Manchester, UK
Visualisation of the HIV-host protein interaction network
Characterising the relationships and interactions between human and HIV proteins is pivotal to our understanding of HIV replication and pathogenesis and provides unique information for the development of safe therapeutic interventions. Visualisation of a network of these interactions helps us explore the plethora of data. Here, coloured spheres and black diamonds correspond to 1400 human and 9 HIV-1 proteins respectively, with grey lines corresponding to one or more unique HIV-1-to-human protein interactions. Sphere diameter and colour indicate the human protein degree (larger and cooler colour indicates more interactions). Spheres are approximately clustered based upon shared interactions, whilst overlapping spheres are a result of the visualization process and do not imply any specific relationship. Data was filtered from the HIV-1, human protein interaction database at NCBI (http://tinyurl.com/hivppi). |
|
Judith Fonville
Imperial College London, UNITED KINGDOM
metabolic constellations
Model of a metabolic trajectory caused by disturbance to homeostasis. In gazing at these images the complex nature of the data is presented clearly, whilst giving a sense of the underlying order that gives rise to this complexity. In a method analogous to early philosophers using constellations to make predictions about future events, this metabolic constellation allows scientists to understand and predict the complex effects of intoxication. |
File Available |
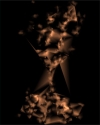
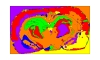
Carlo Vittorio Cannistraci
King Abdullah University for Science and Technology (KAUST), SAUDI ARABIA
Hippocubism – Firing Neuron burns in the desert sunset
I recognized the similarity and I was stupefied: the tree and the fire - I mean – both rooted in the ground and both propagating in the space around.
Then I realized that I love trees: from the spanning tree to the pyramidal neuron, their shapes share the same archetypal symmetry among roots and branches.
Hippocubism is a current in the recently proposed movement Cubism in Computational Biology [1]. Hippocampus: a virtual space where the Nature, our Great Mother, presents some of her masterpieces. My mind is in continuous search for biological patterns and the elegance of pyramidal neurons embedded in the hippocampus was irresistible.
Here, I started from a model of a pyramidal CA3 neuron and following the same methods presented in [1] I algorithmically forged this computational artwork.
1. Carlo Vittorio Cannistraci - A Manifesto for a Cubism movement in Computational Biology, aka CBC¿ - ISMB-ECCB 2009, Stockholm, http://www.iscb.org/ismbeccb2009/artscience.php |
|
Anne Bet
University of Alabama at Birmingham, UNITED STATES
United States
"rEvolution"
Modeled after the iconic pop art work of Andy Warhol, the duplicated image of HIV-1 virions in 293T cells was taken using transmission electron microscopy at 21000x magnification. Our lab focuses on HIV-1 peptides derived from alternative reading frames and recently showed that these "cryptic epitopes" are frequently recognized during HIV-1 infection. Identifying cryptic epitopes relies on pattern recognition techniques and sophisticated software, which has been developed by our collaborators at Microsoft. The art is organized to highlight basic patterns and geometric shapes such as diamonds, circles, and squares.
The title of the work is a play on evolution and action. Despite HIV's ever-evolving genome, our collaborative research efforts forge an unstoppable revolution against this persistent tyrant. |
 |
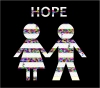
Anne Bet
University of Alabama at Birmingham, UNITED STATES
United States
"One Hope"
Our lab focuses on HIV-1 peptides derived from alternative reading frames and recently showed that these "cryptic epitopes" are frequently recognized during HIV-1 infection. To investigate cryptic epitopes and immune evasion, we study sequences from linked HIV-1 transmission pairs in our Zambian cohort. Beyond the silhouette of the pair, output is displayed from the sequence data that was generated in the GeneiousTM phylogenetic analysis program. Two sequences from one patient are shown: the continuously shaded sequence is the from the initial time point and is the program's reference sequence; the punctately shaded sequence is from the 1 year time point. Both sets of data include the nucleotide sequence at the top, followed by the amino acid residues for all six reading frames below. Shaded residues in the second sequence set correspond to non-synonymous mutations that occurred over time, as compared to the reference sequence. |
 |
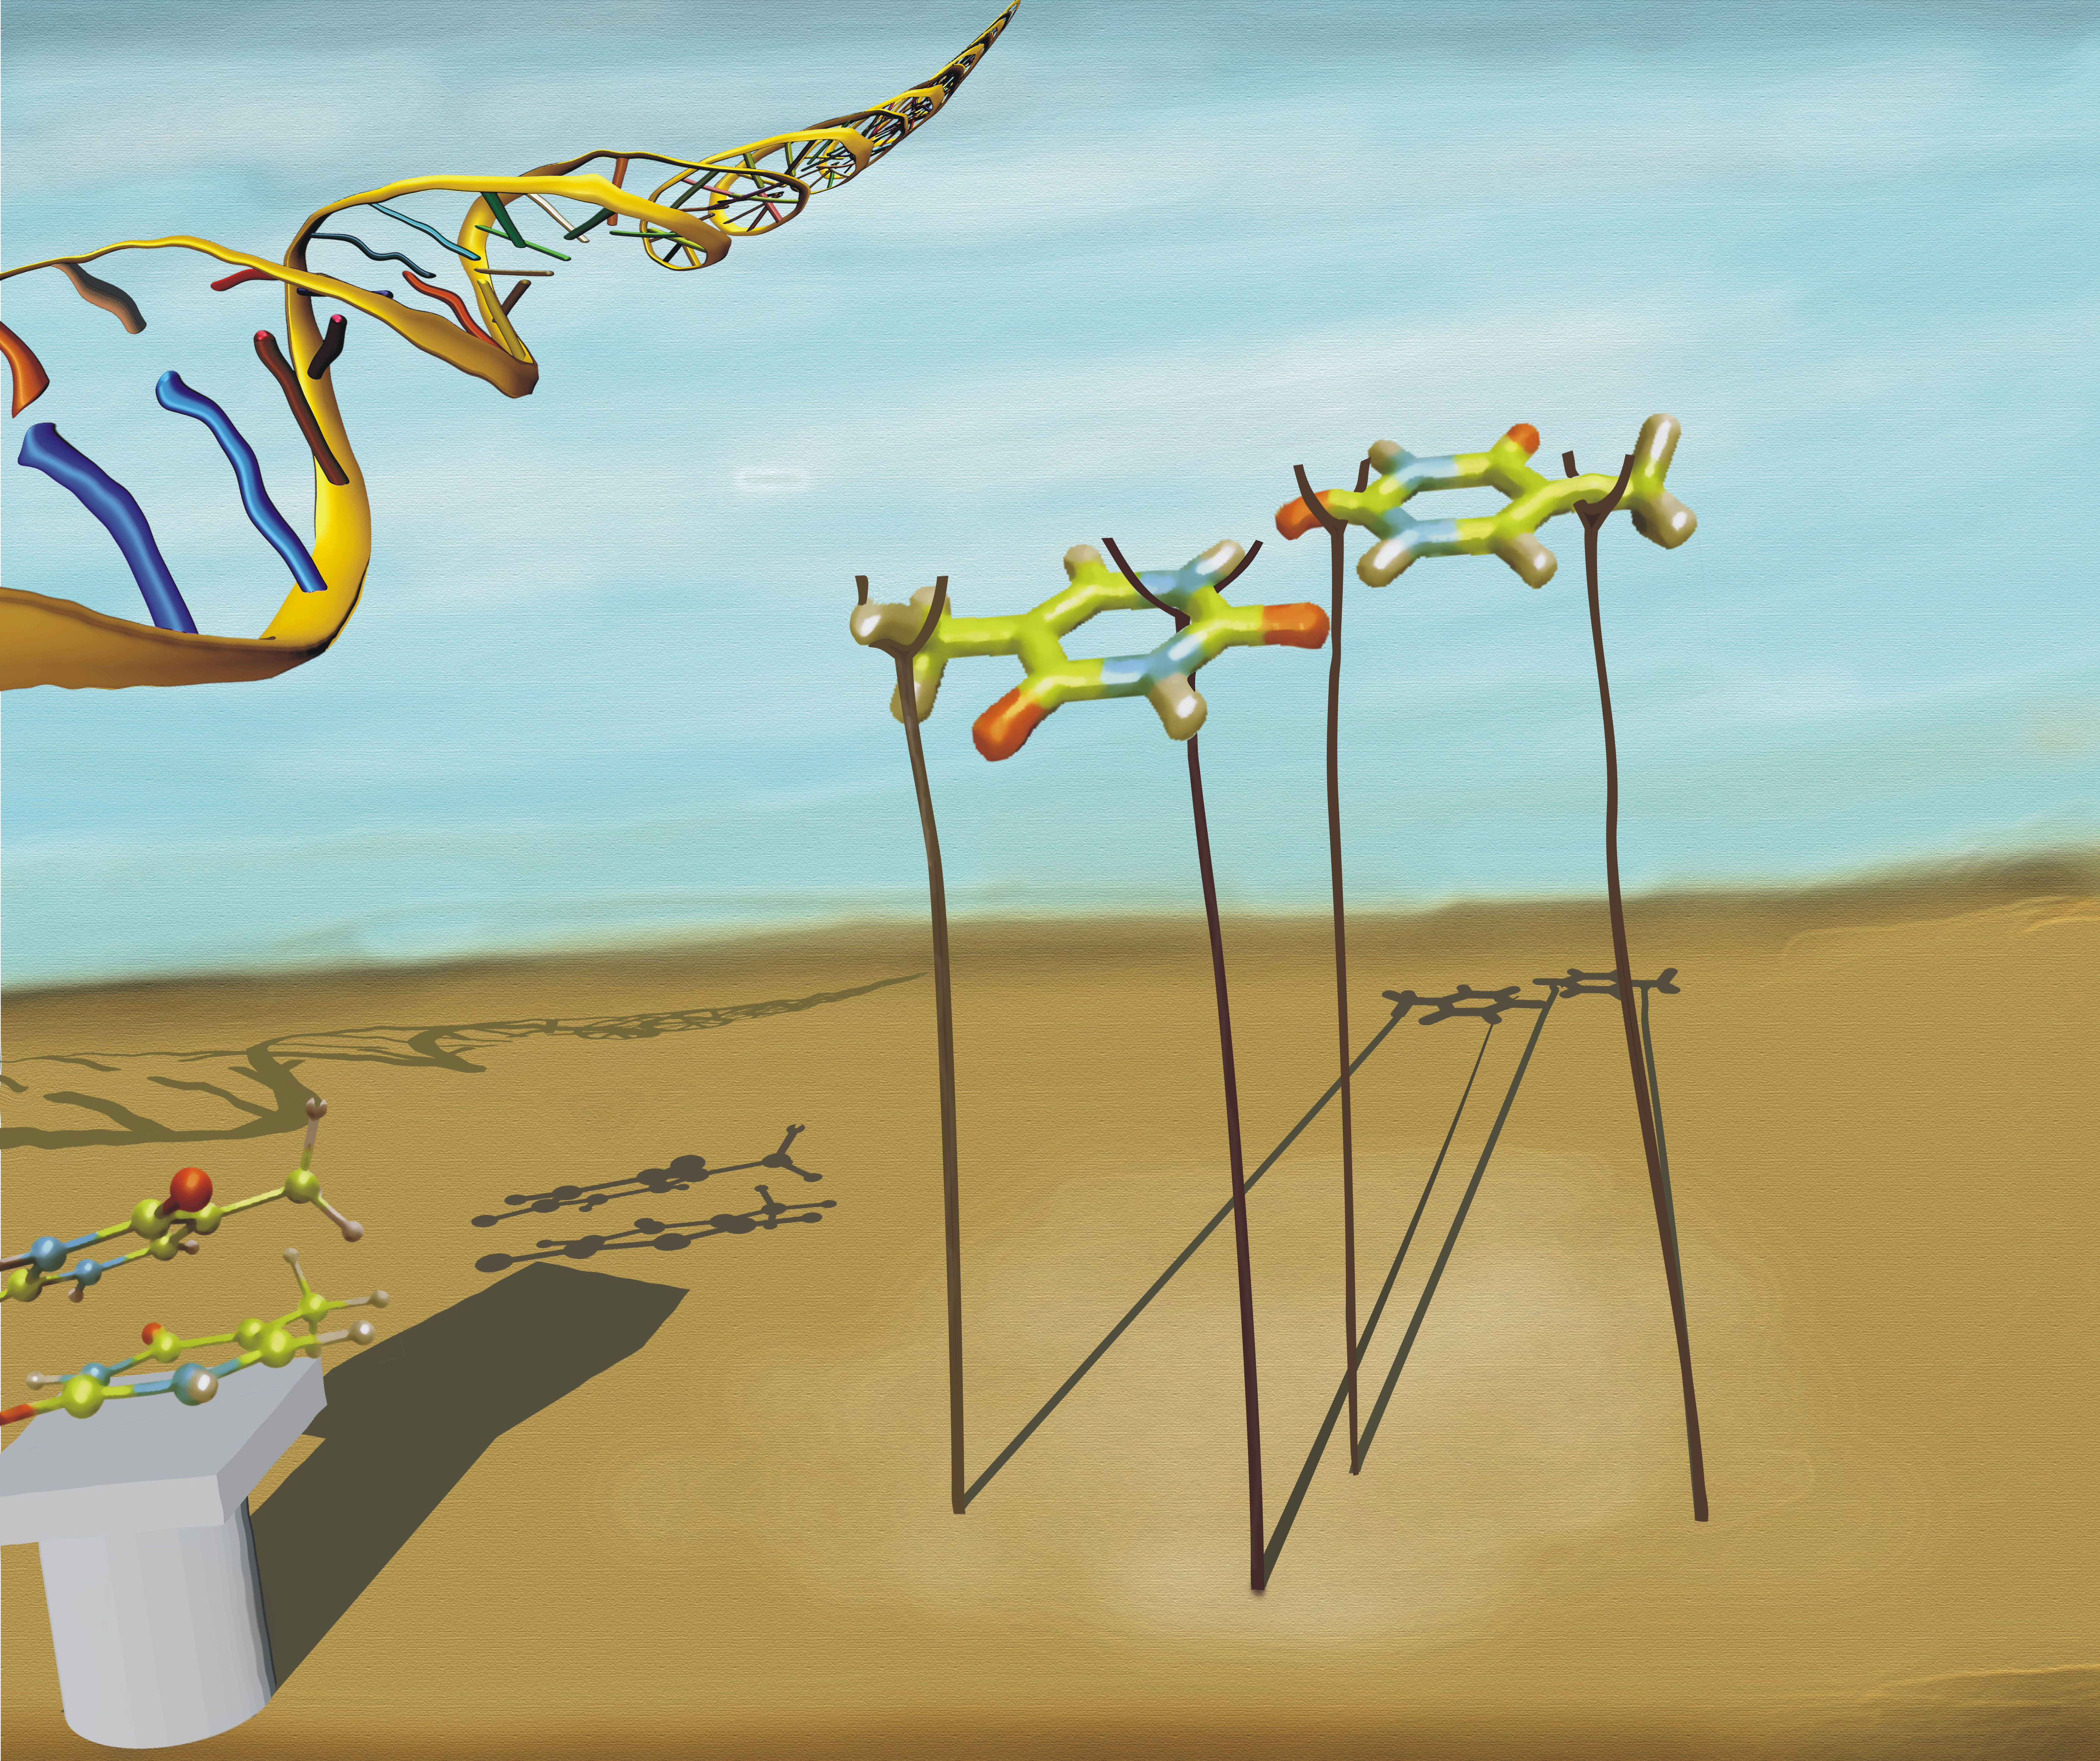
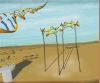
Vadim Mozhayskiy
UC Davis, UNITED STATES
Nucleobases in a vacuum
Dimers of nucleobases in a vacuum is the simplest model system for DNA studies by high level ab initio methods and state of the art spectroscopy. However it lies miles below the Ideal -- a full-scale DNA. Therefore these studies somewhat resemble "Cargo Cults" developed by the some tribes in the 20th century after interaction with technologically advanced cultures (and this picture resembles airplanes made out of straw). However that does not belittle the quality of our state of the art research!
This work (by Vadim Mozhayskiy) was accepted as a cover art for Physical Chemistry Chemical Physics Vol. 12 Issue 10 (2010) for the paper "The effect of TT-stacking, H-bonding, and electrostatic interactions on the ionization energies of nucleic acid bases: adenine–adenine, thymine–thymine and adenine–thymine dimers" by Ksenia B. Bravaya, Oleg Kostko, Musahid Ahmed and Anna I. Krylov, Phys. Chem. Chem. Phys., 12:2292(2010) (DOI: 10.1039/b919930f) |
 |
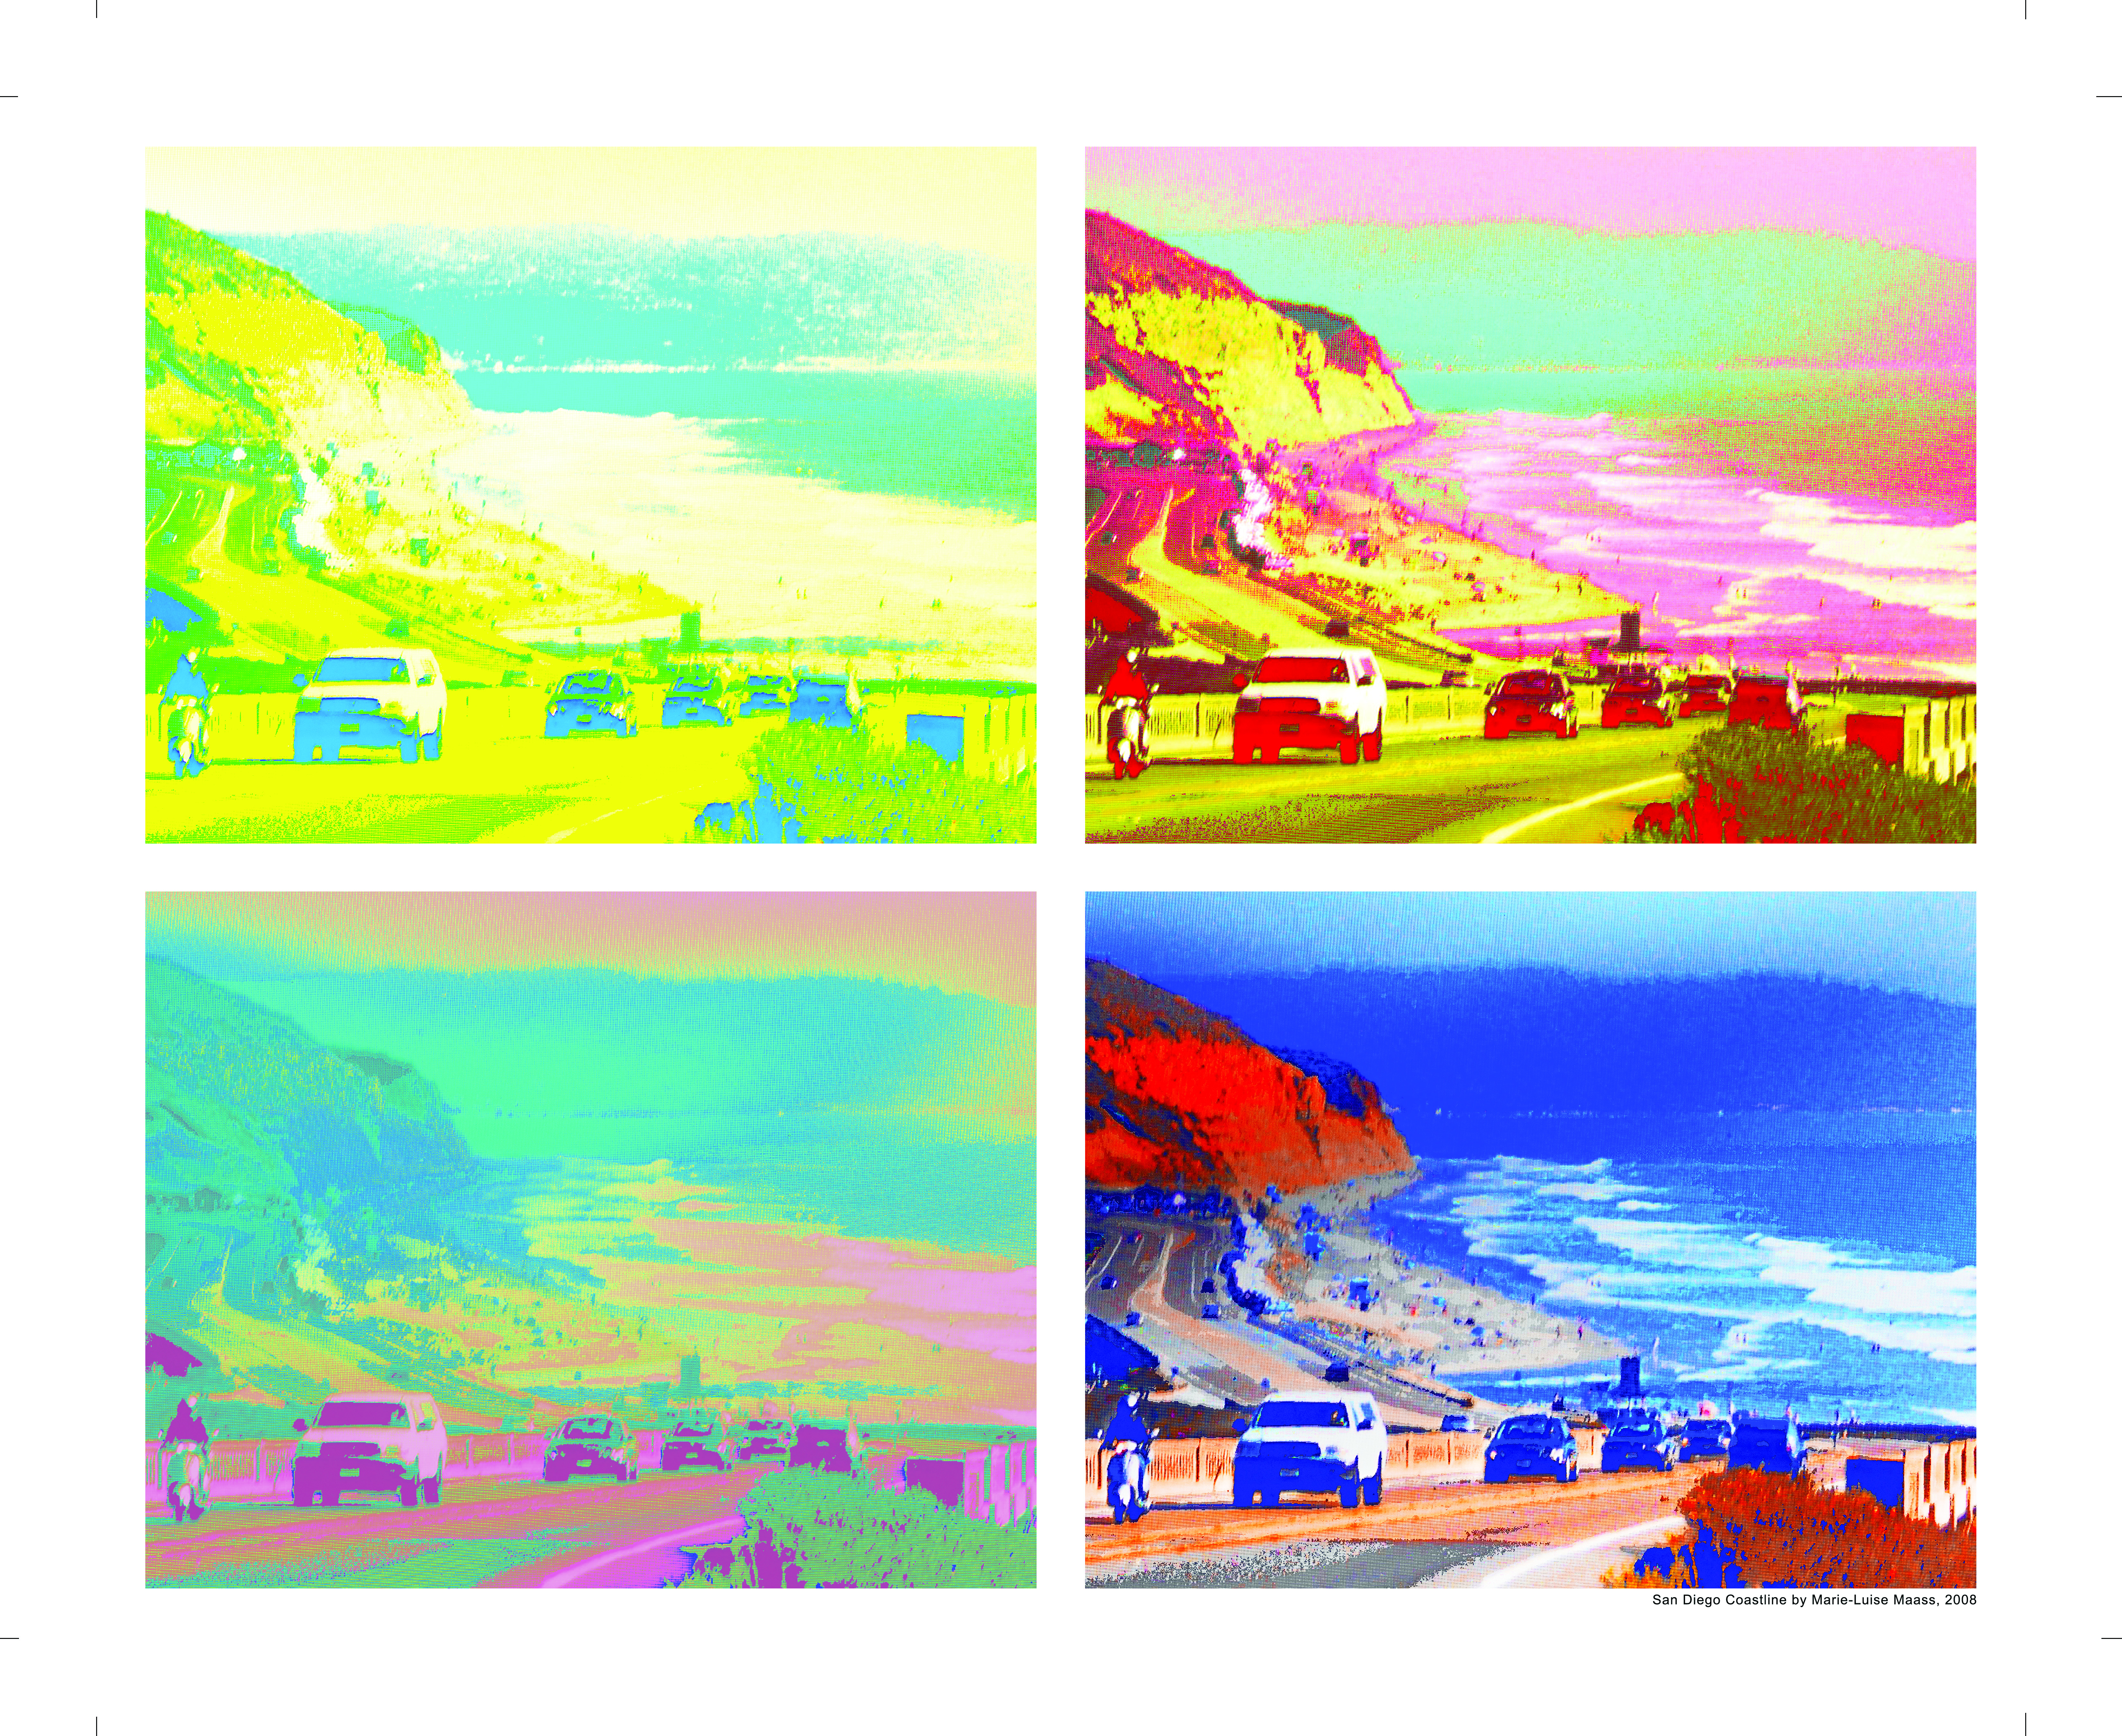
Kary Staples
Roche NimbleGen, UNITED STATES
Jaz Singh, Roche NimbleGen, US
Joanna Mooberry, Roche NimbleGen, US
California Dreaming: An array of artistry
The art of biotechnology-DNA "expressionism": This image demonstrates the inherent flexibility of microarray technologies. To produce this image, a photograph of the San Diego coastline was digitized and converted to a four-level gray-scale image. A distinct 24mer oligonucleotide probe corresponding to perfect match sequence or one, two, or three mismatches was assigned to each of the four gray-scale values. Virtual masks were then designed using this information and a microarray was synthesized/created using Roche NimbleGen's MAS technology. After synthesis, the array was hybridized with a single biotinylated oligonucleotide target corresponding to the perfect match sequence, stained with streptavidin-cy3, and the resulting hybridization data converted back to a color image, with distinct colors applied to each grayscale range. |
 |
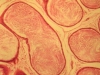
LUKEMAN SHITTU
BENUE STATE UNIVERSITY, NIGERIA
REMILEKUN SHITTU, BOLOMEDICS LABORATORIES, EGBEDA, LAGOS, NG
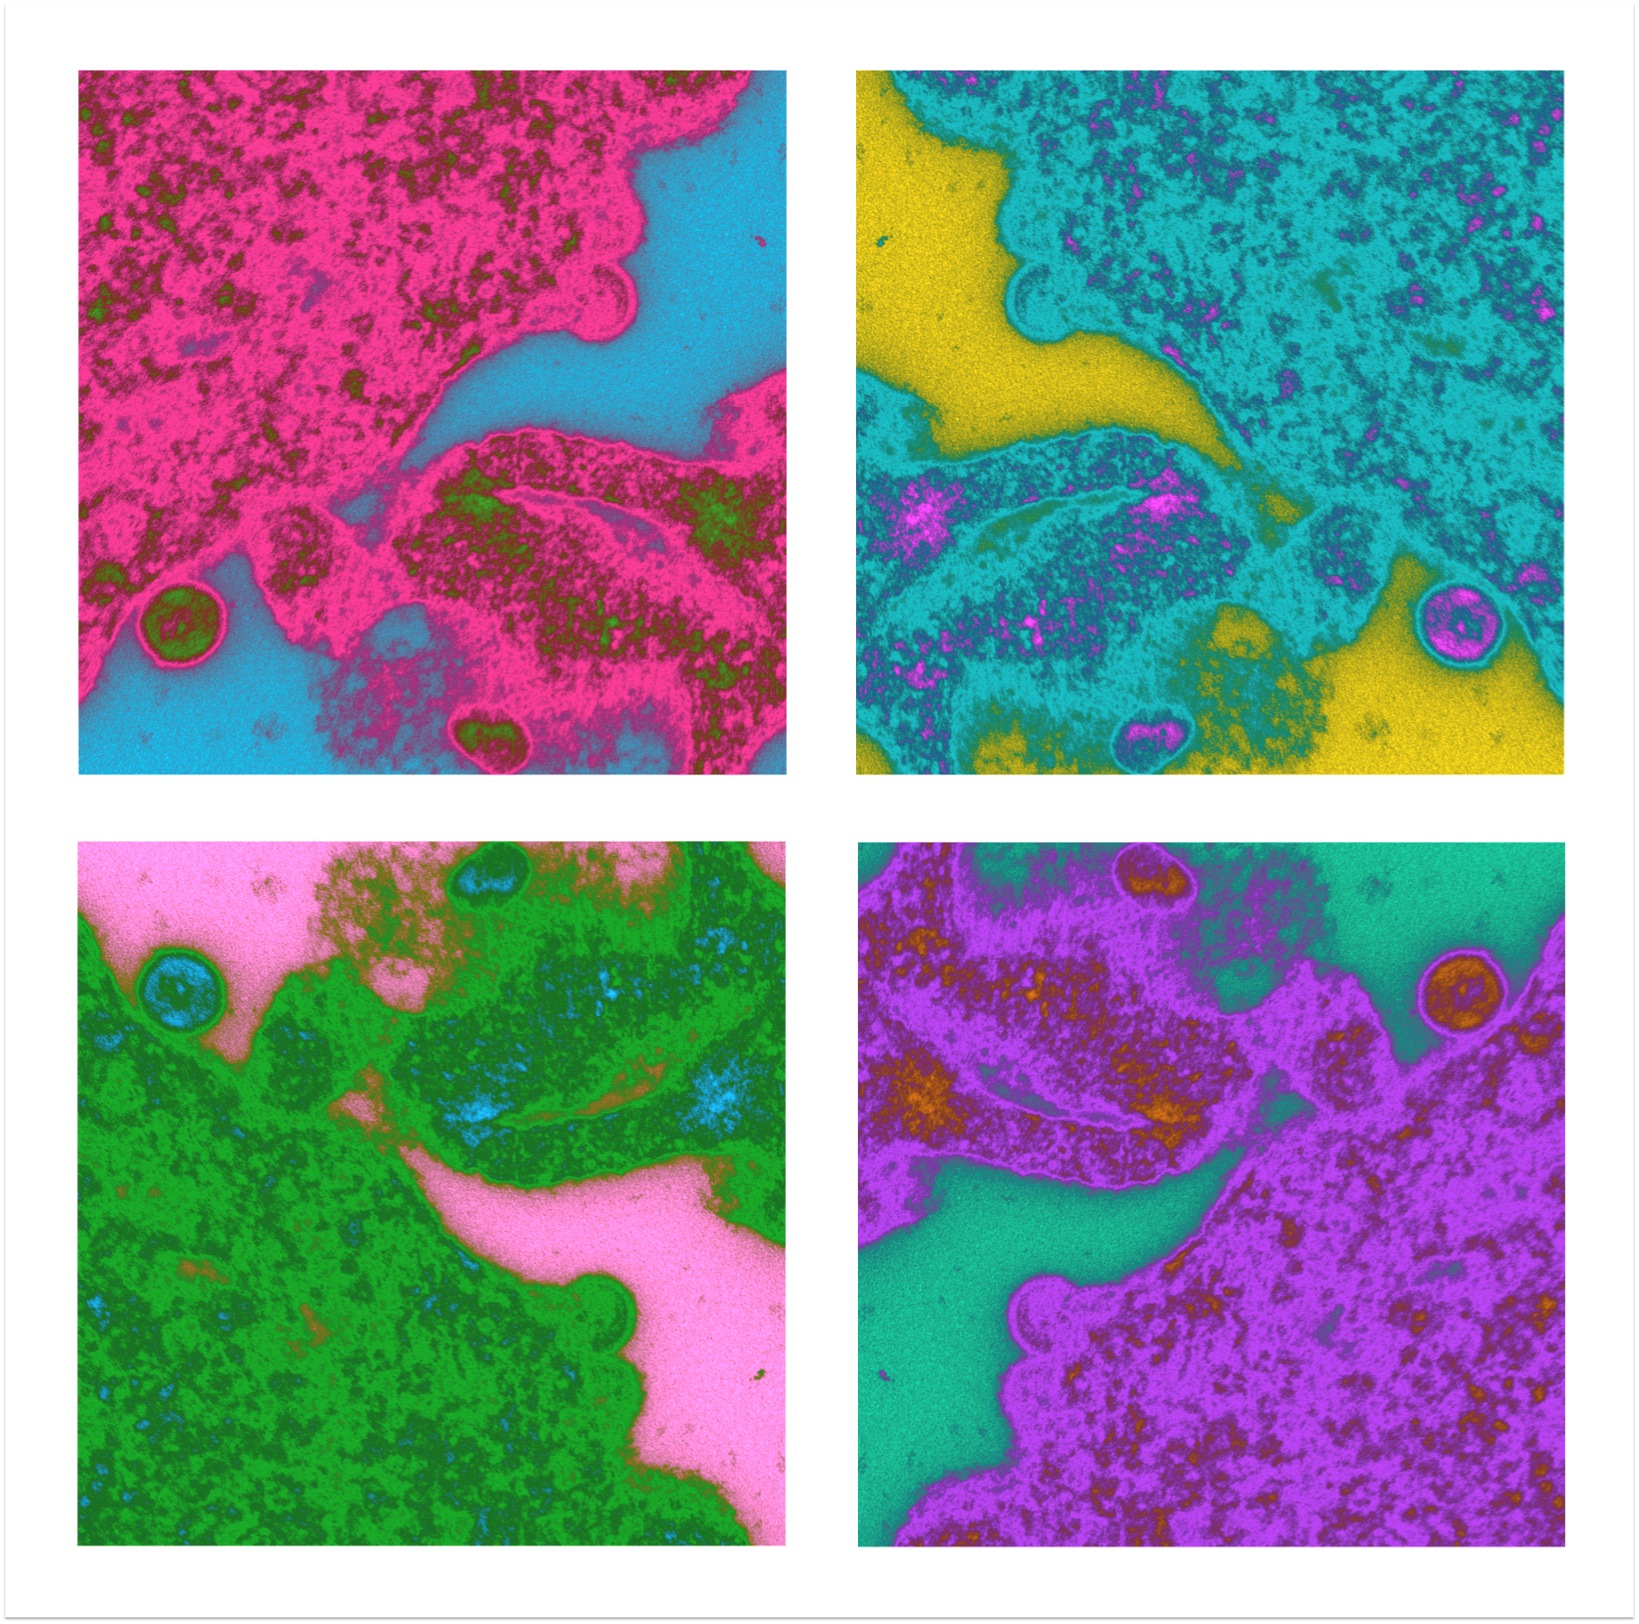
SESAME LEAVES PHYTOESTROGENS TREATED SPRAGUE DAWLEY RAT EPIDIDYMES
The work showed the effects of sesame leaves phytoestrogens on the Sprague Dawley rat epididymis. There is evidence of spermatozoa fullness in the epididymal tubular lumens with associated widening of the tubular lumens when compared with the control. H & E stained SD rat epididymis with X400 magnification was studied in our lab. This result reflected on the positive stimulatory impact of sesame leaves phytoestrogens bindings on the estrogen receptors (alpha & beta) present in the epididymis and the beauty of estrogens in enhancing the male fertility profile and wellbeing. |
 |
Theodore Alexandrov
Univerisity of Bremen, GERMANY
Dennis Trede, University of Bremen, DE
Flower-powering the Brain
This image shows an intermediate result of processing a coronal section of the rat brain measured with matrix-assisted laser desorption/ionization (MALDI) mass spectrometry imaging. The dataset has been measured at Bruker Daltonics, Bremen. The problem of interest is spatial segmentation of this dataset highlighting anatomical structure of the brain.
We were working deeply into the darkness of sophisticated mathematical image processing methods, when this lightsome image came out our view, cheerful and jazzy. |
 |
Kay Nieselt
University of Tuebingen, GERMANY
Kissing Hairpins by the Sea
Logo produced for the EMBO Practical Course on "Computational RNA Biology" held in Cargese, Corsica (France) (see http://www.zbit.uni-tuebingen.de/pas/EMBO-RNACourse). It shows two agaves with the landscape of Corsica in the background. The two agaves are used as models for hairpins, which are among the most common structures observed in RNA secondary structures. The two hairpins can interact by complementary base pairing ("they kiss"). |
File Available |
Shifra Ben-Dor
Weizmann Institute of Science, ISRAEL
Aviad Ben-Dor, Yehuda Halevi Elementary School, IL
Eli Ezrielev, Department of Biological Chemistry, IL
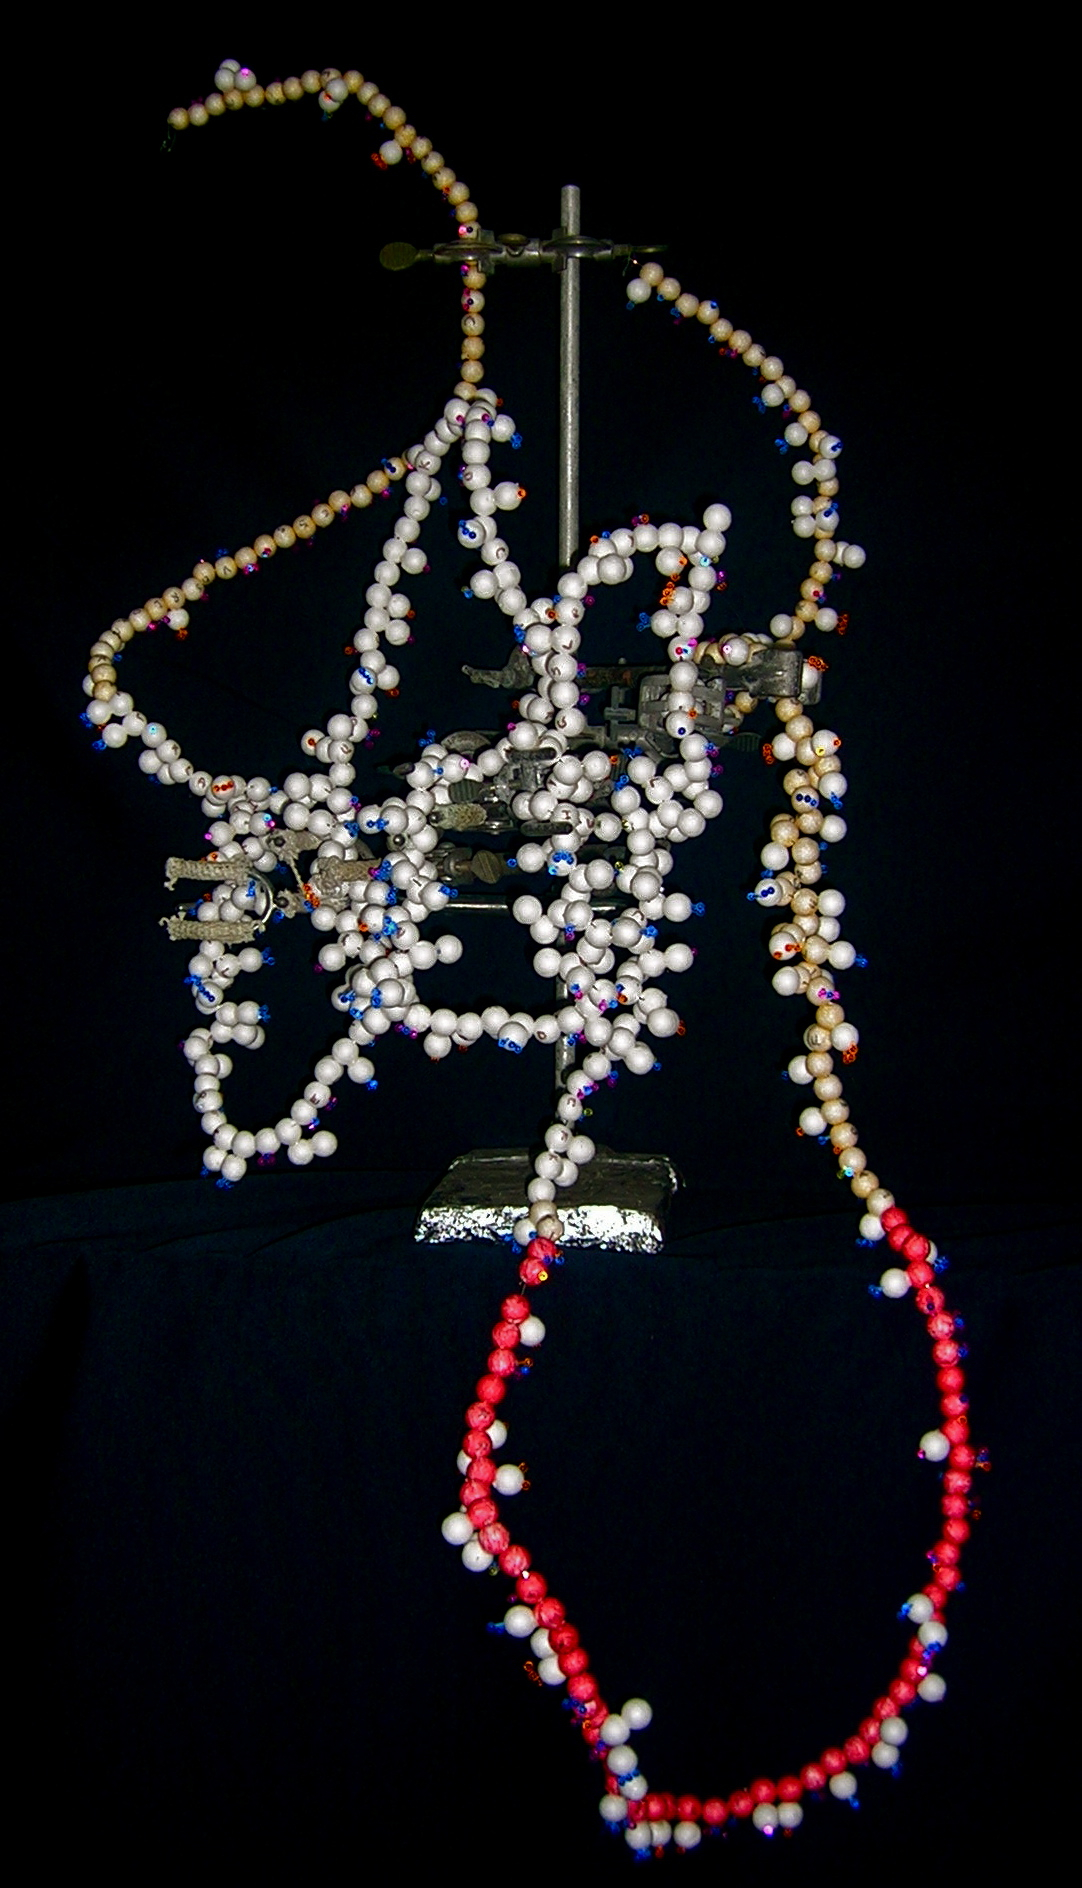
Structure Prediction: Old School
"A physical model is worth 1000 pictures"
This scale model of the human CerS5 protein was built based on a composite of 15 different transmembrane and topology prediction programs. Both building and working with the model gave much more insight into how the protein functions than any computer-visualized model, no matter how nice the rendering.
The domains are color coded - Hox-like domain in red, TLC domain in white, and yellow balls are amino acids not assigned to any domain. Amino acids are represented by styrofoam balls, and side chains by colored pegs, carbon in blue, oxygen in pink, nitrogen in orange, sulfur in yellow. Large side chains were represented by additional balls. The model was constructed backbone first, then transmembranes were twisted (to scale) and side chains added. The final model was suspended using lab clamps.
Thanks to the Futerman Lab for the inspiration. |
 |
Anastasia Baryshnikova
University of Toronto, CANADA
Michael Costanzo, University of Toronto, CA
Chad L. Myers, University of Minnesota, US
Brenda J. Andrews, University of Toronto, CA
Charles Boone, University of Toronto, CA
The Genetic Landscape of a Cell
The genetic interaction network of yeast Saccharomyces cerevisiae. Each node represents a gene. The genes are connected to each other by an edge if they share a similar pattern of genetic interactions, which is common among functionally related genes. An edge-weighted spring-embedded network layout, implemented in Cytoscape, assembles the network such that all genes are positioned relative to one another based upon the similarity of their genetic profiles and, thus, functional similarity. The resultant network shows discrete clusters representing all major cellular processes and represents an unbiased functional map of the cell. |
File Available |
Gil Alterovitz
Harvard/MIT, UNITED STATES
Sophia Yuditskaya, MIT, US
Marco Ramoni, Harvard/MIT, US
Biomolecular Musical Scores for Disease
Our work utilizes music to abstract and present the inherently time-based dynamics of high-dimensional gene expression and protein abundance information. We applied our approach to gene expression and corresponding protein interaction networks. We found that normal samples resulted in harmonious music, while cancer samples were more inharmonious based on both auditory and quantitative metrics. In addition, the dynamics of the cancer samples were such that discordance in sound increased in time as the state worsened, providing a potentially new proxy for loss of control within the underlying protein networks. This work has applications in highly complex real-time work environments (such as operating rooms) that place high demands on the visual modality. By reducing complexity and extracting core biomolecular information in the form of auditory information, this work provides an alternative approach to presenting information which frees the visual modality for other tasks. |
 |
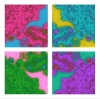
Sylvia Tippmann
FMI, SWITZERLAND
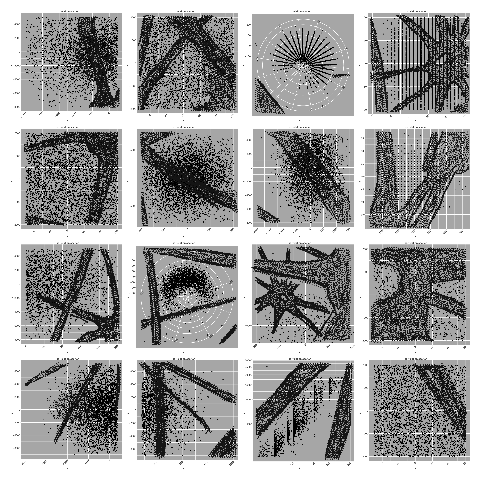
Making sense out of data
Computational biology is most of the time about making sense out of data - large amounts of data. The way to look at these data sets, they way to display, to plot it, is a crucial step towards understanding the biological meaning. The submission is a collage consiting of an arrangement of scatter plots of anonymous variable x and y. The single scatter plots do not show a meaningful correlation, but if you 'assemble' the 'different datasets' in the right way, and step back from the picture, one can see a meaningful biological 'pattern' - in this case a network of neurons. |
Larger PDF
|
Art & Science Videos |
Yuval Itan
UCL, UNITED KINGDOM
Mark Thomas, UCL, UK
Adam Powell, UCL, UK
Joachim Burger, Johannes Gutenberg-University, DE
Mark Beaumont, University of Reading, UK
The origins and spread of lactase persistence in Europe.
Animation graphically representing the geographic frequency distribution of the ?13,910*T allele at 10-generation time slices over the last 9,000 years (assuming a generation time of 25 years), taken from simulations that best fitted data on modern ?13,910*T allele frequency and timing of the arrival of farming in Europe. The cross represents the origin of lactase persistence - darying gene culture co-evolution origin in the specific simulation. |
File Available |
Neo Chung
Princeton University, UNITED STATES
Ashwin Kulothungun, Pratt Institute, US
The Art of Gene Expression Profile and Exploration
Coupled with the completion of the Human Genome Project in 2001, microarray technology opened up unprecedented opportunities for genome-wide assessments of gene expression, the molecular manifestation of genotype and environment. Today, microarrays have become ubiquitous in searching for candidate genes and pathways of biomedical interest. High-throughput microarrays are commercially available at a rapidly decreasing price and innovations continue to increase reproducibility, dynamics, and specificity. Furthermore, microarray platforms allow molecular biologists to simultaneously test a large number of hypotheses based on differential expression of tens thousands genes, which requires modern statistical inference. The evolution and refinement of such experiments in the last decade have not only made functional genomics and clinical genomics feasible, but also changed how molecular biologists utilize computational systems. From hybridization and data extraction to clustering and network analysis, this 3D animation is inspired by microarray experiments and illustrates the surprising beauty of a complex gene expression profile. |
File Available |
Art & Science Images - Projection Only |
Benard Kulohoma
Malawi-Liverpool-Wellcome Trust clinical research programme, MALAWI
Flower
The "Flower" consists of a mosaic of Streptococcus pneumomiae (pneumococcus) clonal complexes. Each clonal complexes shows the evolutionary relationship of the pneumococcal isolates of a particular genetic lineage. The central pneumococcal isolate sequence type 63 (ST 63) represents the center of the flower. It is the founding clone of that clonal complex. The petals are represented by its single locus variants that have diversified over time. The flower also has a stem, leaves and some buds need its root |
 |
Suzanne Paley
SRI International, UNITED STATES
Peter Karp, SRI International, US
Escherichia coli Cellular Overview
This diagram is a visual representation of the Escherichia coli biochemical network. It is automatically generated by the Pathway Tools software based on the contents of the EcoCyc database. Each node of the graph represents a metabolite, and each edge represents a reaction. Reactions are organized into pathways, and colored according to pathway class. The two borders represent the inner and outer cell membranes, enabling depiction of transport reactions and membrane proteins. Using the Pathway Tools software or the ecocyc.org website, users can query and manipulate the diagram to identify objects of interest, highlight objects using a variety of criteria, or color the diagram to show various kinds of high-throughput data in a pathway context. |
File Available |
Sergei Larionov
Moscow State University, RUSSIA
Maria Poptsova, Cornell University, US
Alexander Loskutov, Moscow State University, RU
Eugeny Ryadchenko, Moscow State University, RU
Sergei Rybalko, Universite de Franche-Comte, FR
Ilya Zakharov, Vavilov Institute of General Genetics, RU
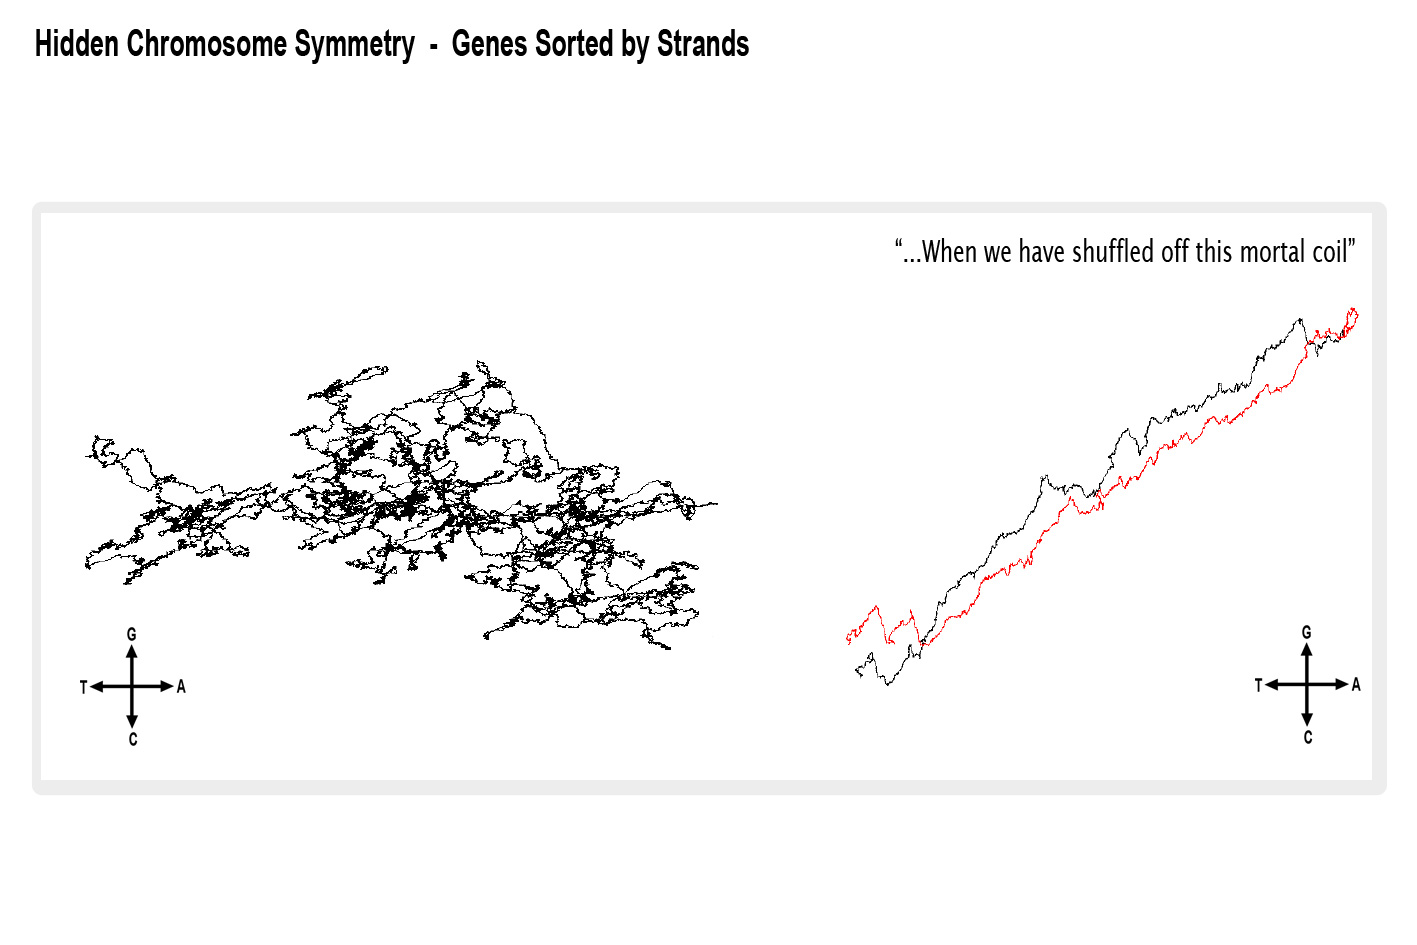
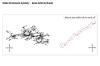
Hidden Chromosome Symmetry - Genes Sorted by Strands
2D DNA graphs of all genes from Saccharomyces cerevisiae, chromosome 16. Trajectories of the genes in the original order are shown on the left, genes sorted by strands transformed trajectories on the right.
Maps of 2D DNA walk of 671 examined chromosomes show composition complexity change from symmetrical half-turn in bacteria to pseudo-random trajectories in archaea, fungi and humans. In silico transformation of gene order and strand position returns most of the analyzed chromosomes to a symmetrical bacterial-like state with one transition point. The transformed chromosomal sequences also reveal remarkable segmental compositional symmetry between regions from different strands located equidistantly from the transition point. Despite extensive chromosome rearrangement the relation of gene numbers on opposite strands for chromosomes of different taxa varies in narrow limits around unity. Similar relation is observed for total genes' length and cumulative GC and AT skews. This is also true for human coding sequences, which comprise only several percent of the entire chromosome length.
Maria S. Poptsova, Sergei A. Larionov, Eugeny V. Ryadchenko, Sergei D. Rybalko, Ilya A. Zakharov, Alexander Loskutov. Hidden Chromosome Symmetry. PLoS ONE 4(7): e6396 |
 |
Top |