


Art and Science Exhibition
ISMB 2018 brings together scientists from a wide range of disciplines, including biology, medicine, computer science, mathematics and statistics. In these fields people are constantly dealing with information in visual form: from microscope images and photographs of gels to scatter plots, network graphs and phylogenetic trees, structural formulae and protein models to flow diagrams; visual aids for problem-solving are omnipresent.
Some of the works of the first such exhibition at the ISMB 2008 in Toronto combine outstanding beauty and aesthetics with deep insight that perfectly proves the validity of our approach or goes beyond the problem's solution. Others were surprising and inspiring through the transition from science to art, opening our eyes and minds to reflect on the work that we are undertaking.
The Art & Science Exhibition 2018 presents the artworks that have been generated as part of research projects. They are also soliciting images resulting from creative efforts that involve scientific concepts or employ scientific tools and methods.
Art in Science Printing Size:
When preparing accepted posters please note that your poster should not exceed the following dimensions: 46 inches wide by 45 inches high. There will be 2 posters per side on the each poster board
Click image to download larger file
|
Marwan Abdellah École polytechnique fédérale de Lausanne (EPFL), In Silico Brainbow In silico brainbow optical section of a neocortical slice (920 × 640 × 1740 μm3) created with a virtual light-sheet fluorescence microscope (LSFM). The simulation of the LSFM is performed on a physically-plausible basis using Monte Carlo ray tracing and geometric optics. The tissue model is reconstructed in a three-step process: 1) converting the morphological skeletons of the neurons into piecewise surface meshes that represent their membranes, 2) reconstructing a volumetric model of the tissue using solid voxelization and finally 3) tagging the neurons with the optical properties of the neocortical tissue and also the spectroscopic properties of different fluorescent dyes. The slice is virtually-tagged with six different fluorescent proteins (GFP, CFP, eCFP, mBanana, mCherry and mPlum) and illuminated at the maximum excitation wavelength of each respective dye. | 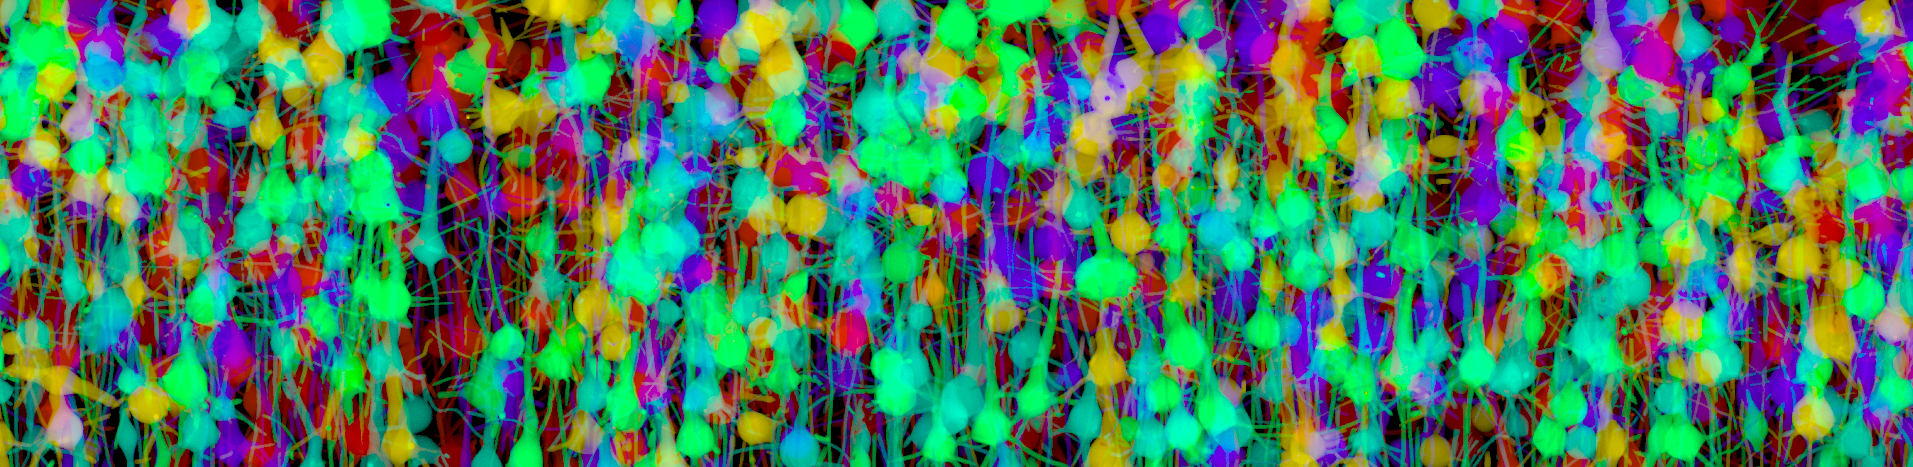 |
|
Aimee Taylor Harvard T.H. Chan School of Public Health, Diego Echevarry, Purdue University, United States Timothy Anderson, Texas Biomedical Research Institute, United States Daniel Neafsey, Havard T.H. Chan School of Public Health, United States Caroline Buckee, Harvard T.H. Chan School of Public Health, United States Spatiotemporal connectivity between malaria parasites sampled from ports on the Colombian pacific coast. Each black dot represents a comparison between a pair of malaria parasite samples, one from Buenaventura, a port on the Colombia’s Pacific coast, another from Tumaco, a port south of Buenaventura, also on the Colombian Pacific coast. The dots are plotted according to their parasite sample collection dates: dots in the top pink halves of the plots represent comparisons where the sample from Buenaventura predates that from Tumaco; dots in the bottom blue halves of the plots represent comparisons where the sample from Buenaventura postdates that from Tumaco. Both horizontal and vertical axes range from the 1st January 1993 to the 31st December 2007. The left-hand plot shows all pairwise comparisons between malaria parasite samples available from Buenaventura and Tumaco. The right-hand plot shows only those with estimated kinship greater than or equal to 0.5 (i.e. only those with evidence of being highly genetically related to one another). Parasite samples were collected from Buenaventura across all aforesaid years. Parasite samples were collected from Tumaco from 1999 onwards. Of all the parasite samples collected before 2000 in Buenaventura, only one was highly related to a sample collected much later from Tumaco. Many of those sampled from Buenaventura after 2004 are highly related to those sampled from Tumaco between 2001 and 2007, but not all, suggesting that there could have been some clonal expansion following travel between ports, but not of one single clone, and thus that some transmission might be sustained by sporadic travel, with implications for malaria control. | 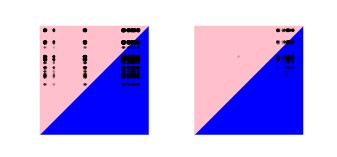 |
|
Aimee Taylor Harvard T.H. Chan School of Public Health, James Watson, Mahidol Oxford Tropical Medicine Research Unit, Thailand Caroline Buckee, Harvard T.H. Chan School of Public Health, United States Mallika Imwong, Mahidol Oxford Tropical Medicine Research Unit, Thailand Cindy Chu, Mahidol Oxford Tropical Medicine Research Unit, Thailand Nicholas White, Mahidol Oxford Tropical Medicine Research Unit, Thailand Visual evidence of relapse in Plasmodium vivax genetic data This is a visualization of Plasmodium vivax genetic data from a randomized control trial of treatment for P. vivax malaria. A heat map, delineated by two vertical gray-scale columns, represents the data. The gray-scale column on the right separates the heat map from its legend of seven colored columns. Considering the heat map, each colored row is an episode of P. vivax malaria (432 in total). Episodes are grouped per person, as indicated by the gray-scale columns, where blocks group episodes experienced by different individuals. There are seven colored columns in the heat map, each one representing a different microsatellite genetic marker. To denote observed alleles, each marker has its own color scheme. The seven colored columns of the legend, arranged in the same order as the microsatellite markers, represent each color scheme. They map onto alleles ranked by size, not repeat length, since not all lengths were observed. As such, adjacent colors within a scheme may differ by more than one repeat. The color scheme was carefully designed to capture the diversity of alleles at each marker. For a given episode and marker, multiple colors within a column represent the detection of multiple P. vivax genotypes (i.e. a multiclonal infection). White represents missing data. Scrutiny of the plot reveals evidence to suggest some infections are caused by parasites that are clones and or meiotic siblings of parasites genotyped in previous episodes, and therefore likely relapses. | 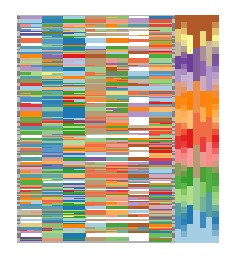 |
|
James Watson Oxford University, Minimum inhibitory concentrations of slowly eliminated anti-malarial drugs Many anti-malarial drugs are highly unusual. They remain in the body for weeks to months and concentrations vary enormously between individuals. The efficacy of these drugs is almost entirely determined by the minimum inhibitory concentration, the MIC, which is the concentration in the blood corresponding to suspended parasite growth. These slowly eliminated drugs are the Dr Watsons of antimalarial therapy. They are the partners in crime of Sherlock Holmes, a fast killing but short lived drug: artemisinin. They plod on, finishing off the work, killing the remaining parasites but only as long as concentrations stay above the MIC. These threshold dynamics, ultimately defining whether a patient is cured, occur at submicroscopic levels and are very difficult to measure. For this reason, we have developed an approximate Bayesian computation algorithm for the estimation of the MIC in patients based on the information provided by the time interval from initial treatment until recurrent infection. Large scale simulations allow for an in-depth understanding of the importance of different epidemiological parameters within this model. Graphical visualization of the output of these simulations is an important method for understanding the interplay of the many parameters determining outcomes in areas of high malaria transmission, and accurately characterizing the concentration below which a drug is no longer protective. | 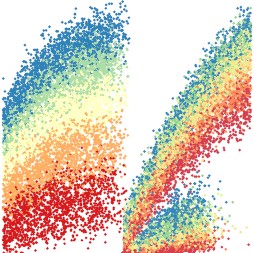 |
|
Gon Carmi Bar-Ilan University, David Karasik , Bar-Ilan University, Israel Make heads and talis of zebrafish Zebrafish (Danio rerio) is a useful model for the human’s physiology and disease such as osteoporosis. Embryogenesis and development are also studied in zebrafish for example, malfunction in early stages of skeletogenesis can increase the fracture risk in subsequent stages of life. In addition, interactions between multiple tissues such as muscles and adipose, can be studied simultaneously in zebrafish. Diverse techniques can be applied to zebrafish both adult and embryo, such as histological and fluorescent staining and microCT imaging. This collection includes a 2X Overlay (green and transmission) of live zebrafish embryos within 96 well plate, MicroCT image of head of zebrafish, image of embryonic zebrafish and an image of osteoclast cells. | 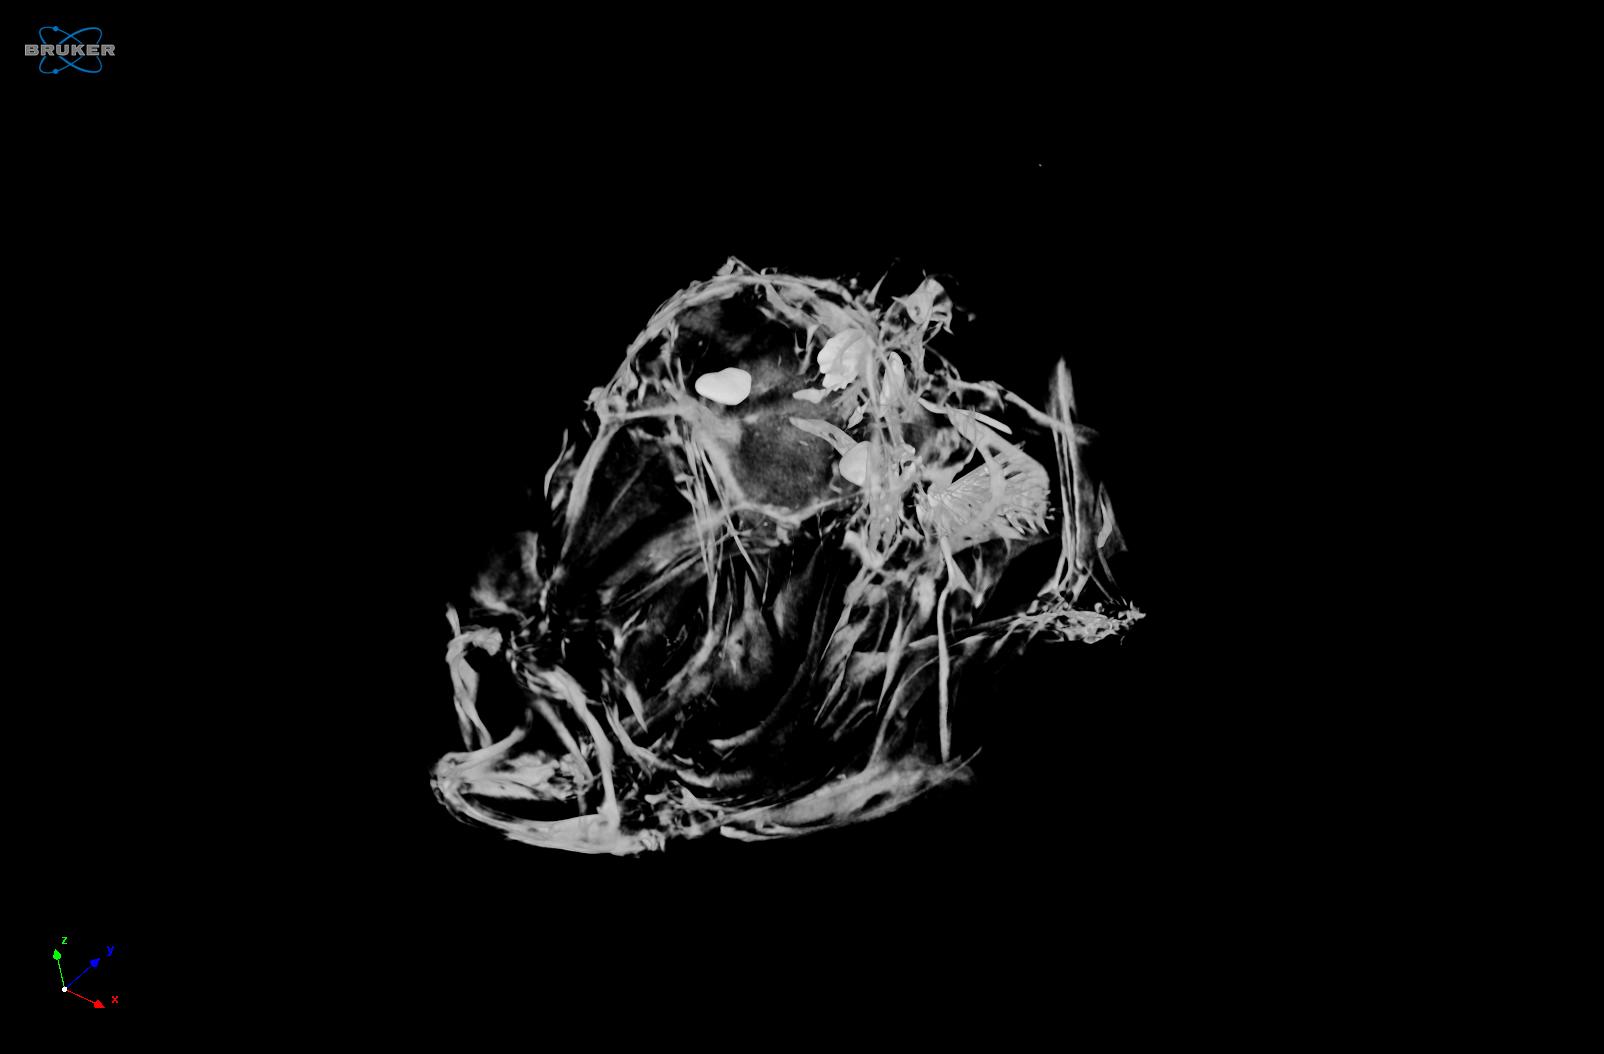 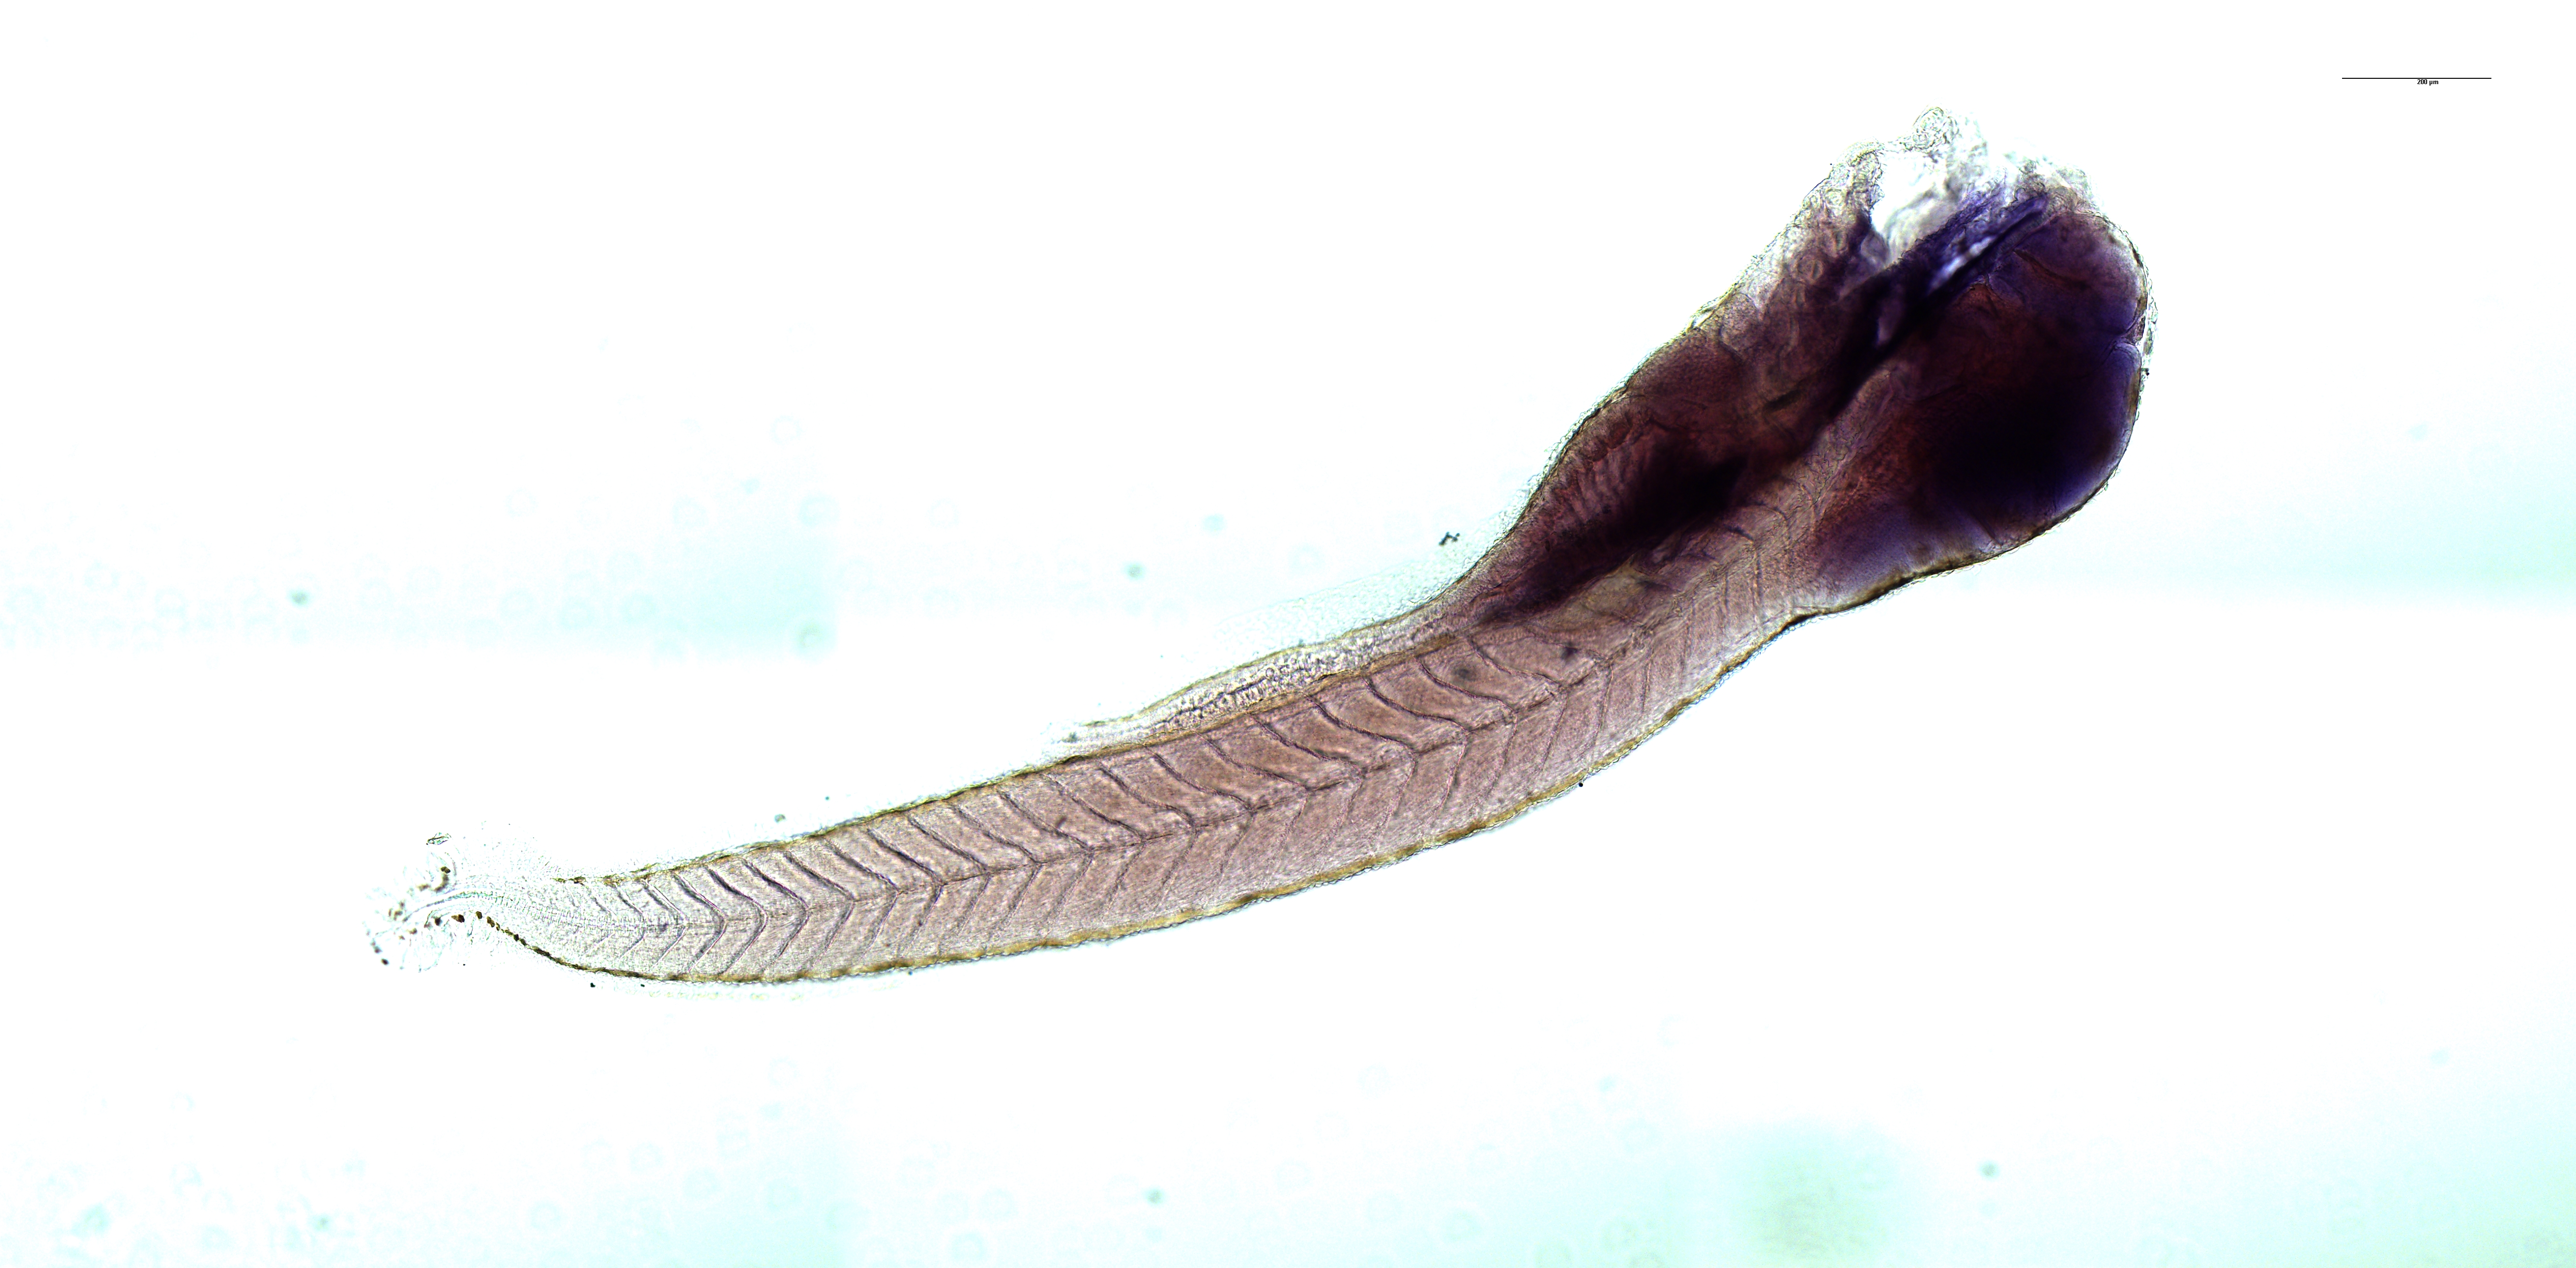 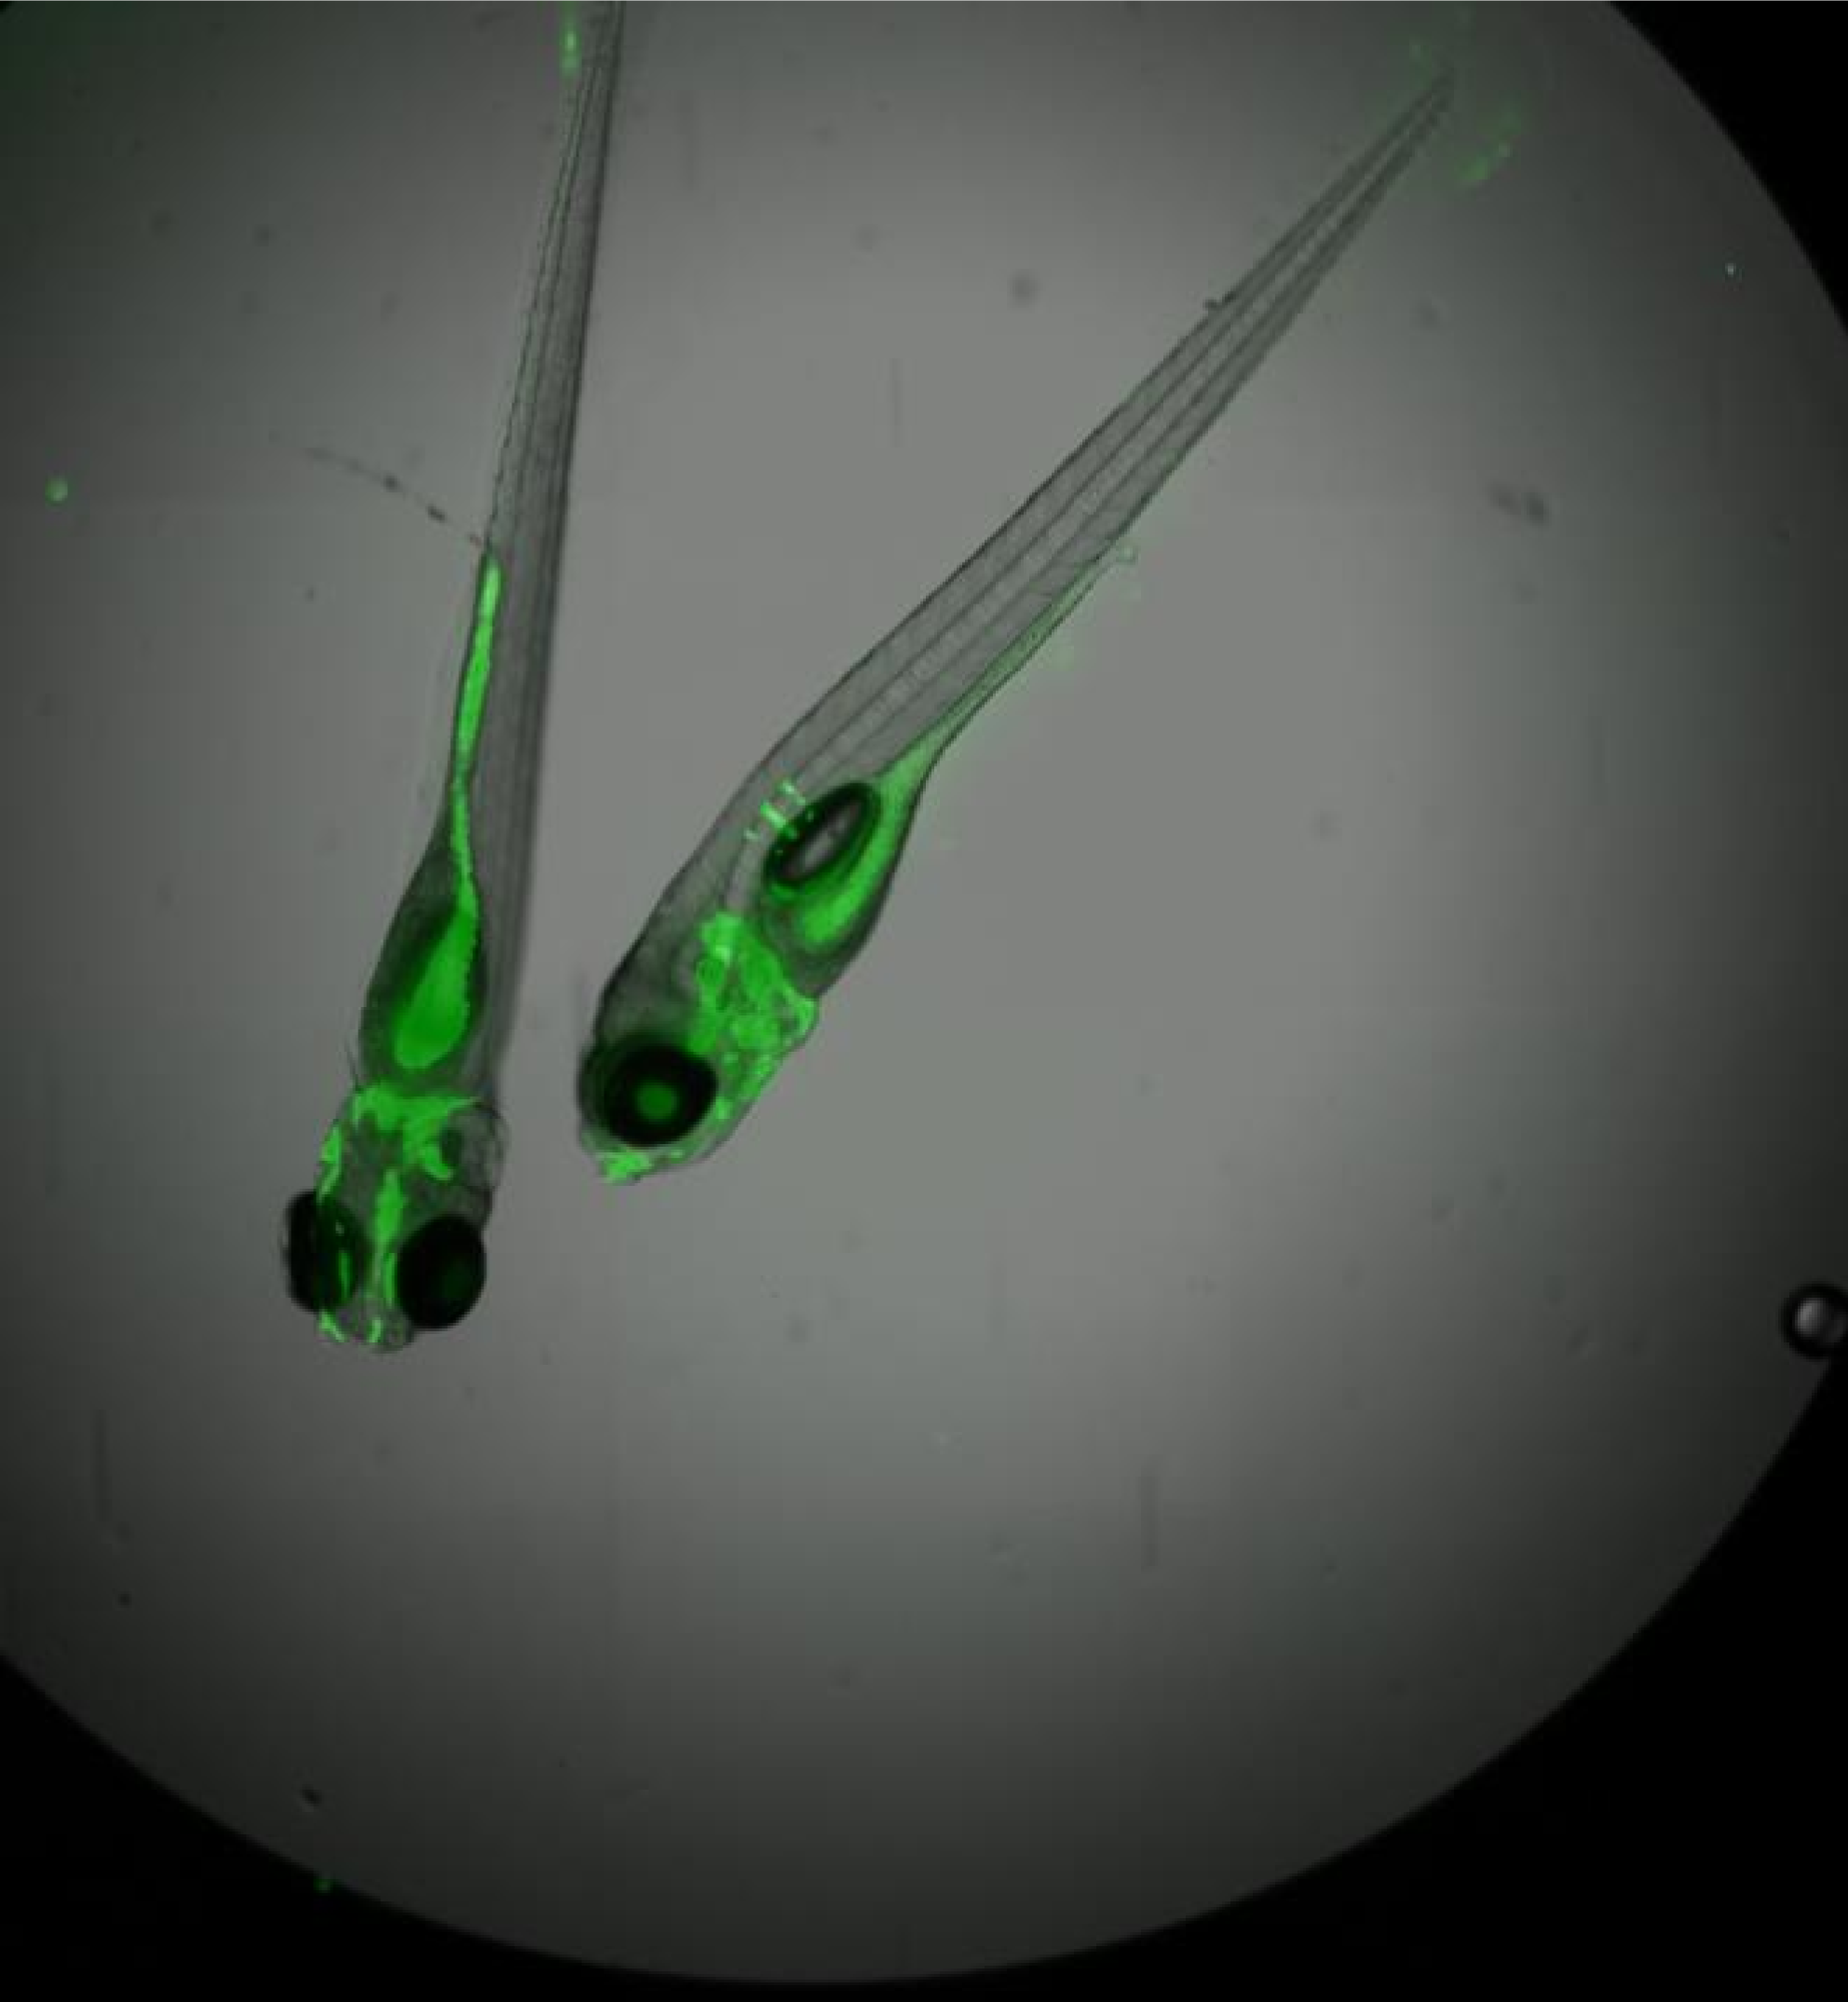 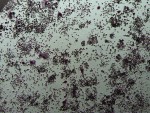 |
|
Courtney Barr Louisiana State University, DNA Loops: Visualizing Genetic Relationships The DNA Loops font allows a user to translate a text-based genetic sequence into color-coded ligature symbols, so that the genetic base pairs A, C, T, and G can be transformed into a set of visually compelling graphic symbols. In this data-driven creative information display, the DNA Loops font has been utilized to create a custom visual comparison of DNA sequences between related individuals (myself and my grandmother). My goal with this method is to merge graphic design and data visualization to communicate complex scientific information in a way that is compelling and accessible to both a scientific and non-scientific audience. I envision the possibility of developing a system of DNA visualizations that can be uniquely customized to the individual or potential client, for a multitude of end-products, from fine art prints to custom DNA textiles. | 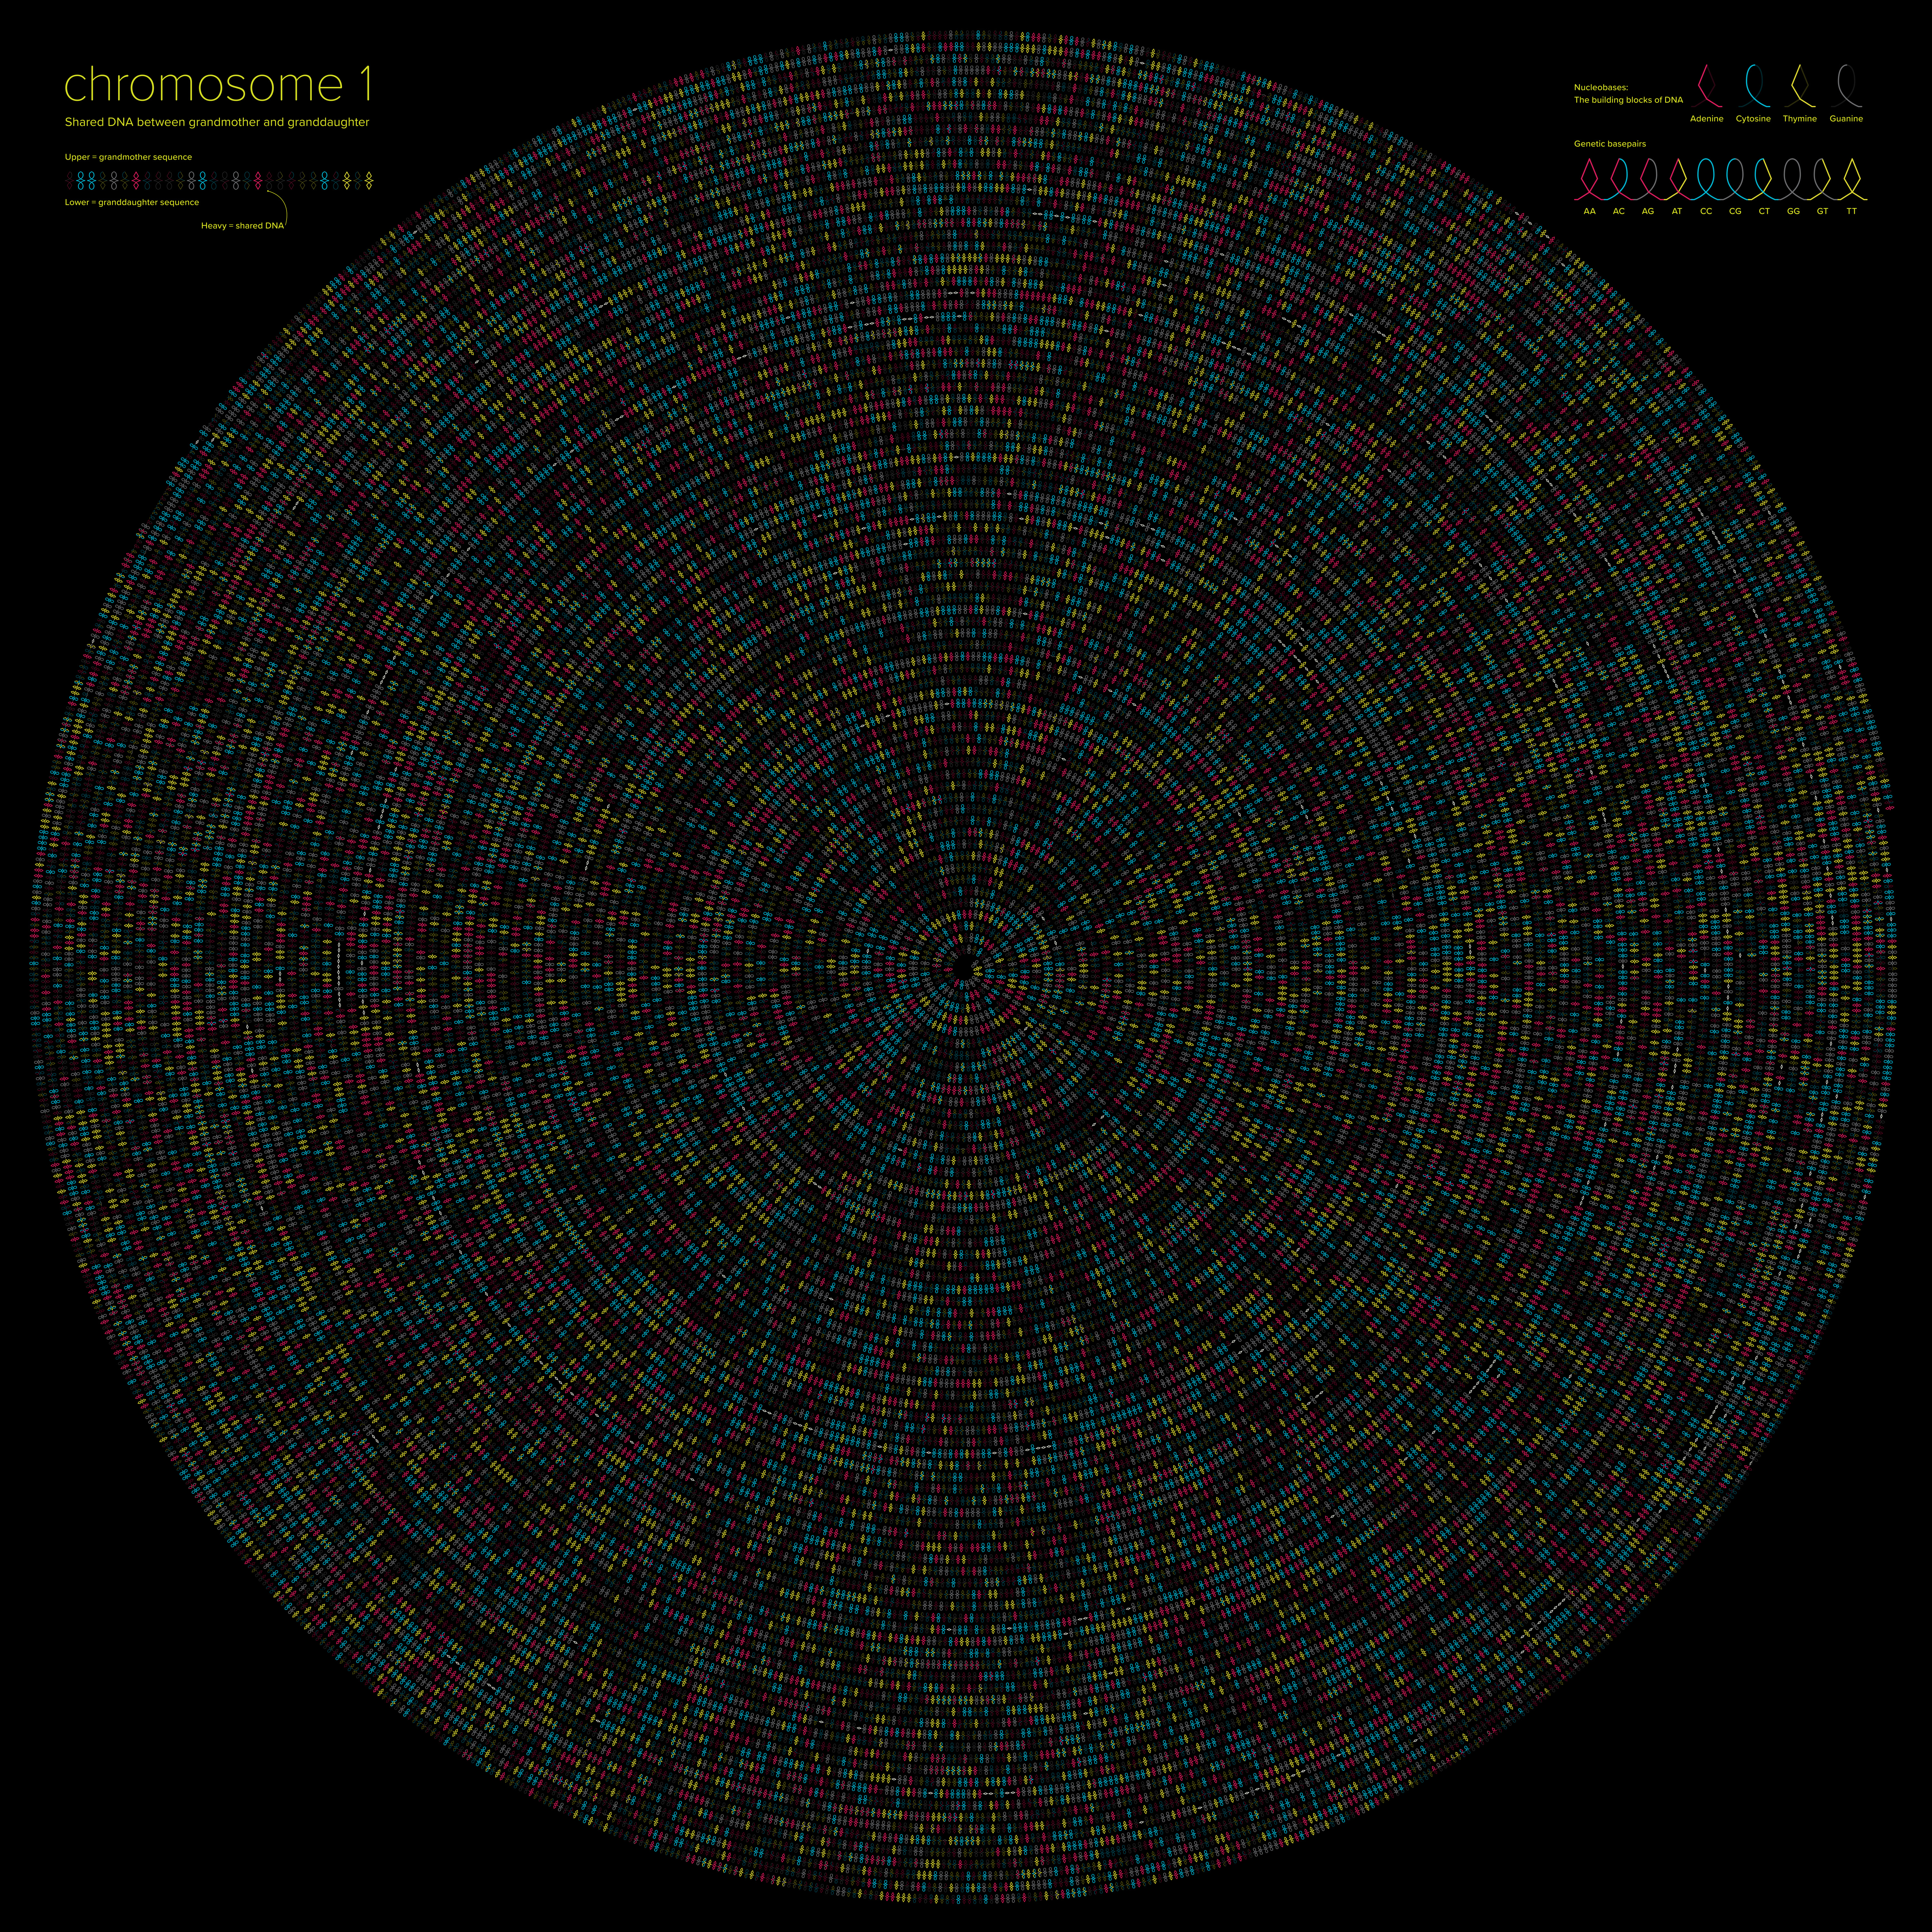 |
|
Anuroopa sanju Department of Computational Biology and Bioinformatics, Molecular Docking Molecular docking is the computational analysis of biological interactions at the molecular level. In molecular docking, the interactions are observed between small molecules and a macromolecule which can be the key factor of a particular disease. The specific binder can act as an activator or inhibitor of the target molecule and hence can modulate the reaction in a desirable way. | 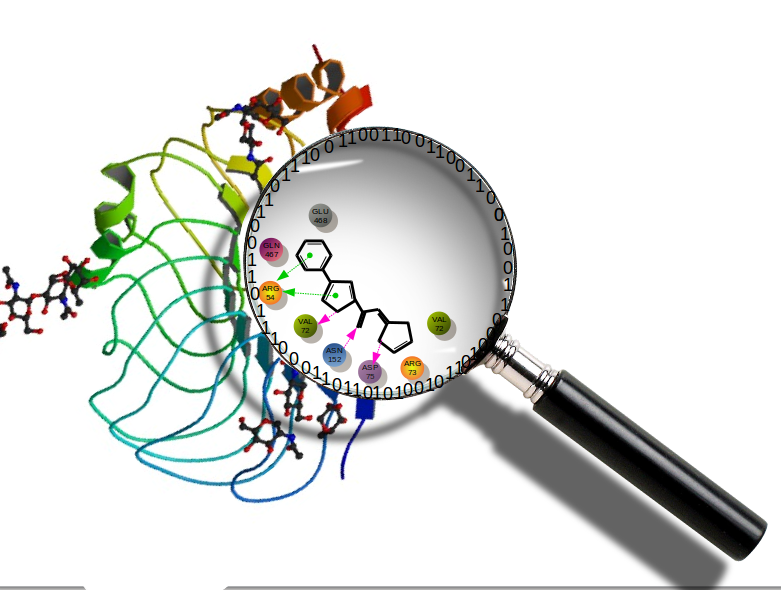 |
|
Ruth Callaway Swansea University, Biosciences, UK, Mondrian’s Sum of Squares Science inspired many artist, but here it was the other way around. The visualisation of marine biodiversity data was modelled on paintings by the early 20th century Dutch artist Piet Mondrian. It is an ongoing challenge for ecologists to compress and simplify complex data and to illustrate patterns in marine ecosystems. Differently coloured and sized rectangles and squares were assembled in this Mondrian’s Sum of Squares and simultaneously shows numerical and taxonomic information of a benthic invertebrate seafloor community (Swansea Bay, Wales, UK). Each field, large or small, represents a different species. The size of the square or rectangle indicates how numerically common a species was, and colours indicate taxonomic or functional groups (blue: polychaete worms, yellow: bivalves, red: crustaceans, white: other mobile species, grey: other sessile species). The few large squares highlight that the seafloor community consists of just a handful of common species, while most occur in low densities. The overwhelming number of blue fields shows the importance of worm species for biodiversity. Like many of Mondrian’s paintings, this artwork is an abstract representation of the natural world. It differs in that Piet Mondrian deliberately stepped away from reality, while this work translates scientific data into art. | 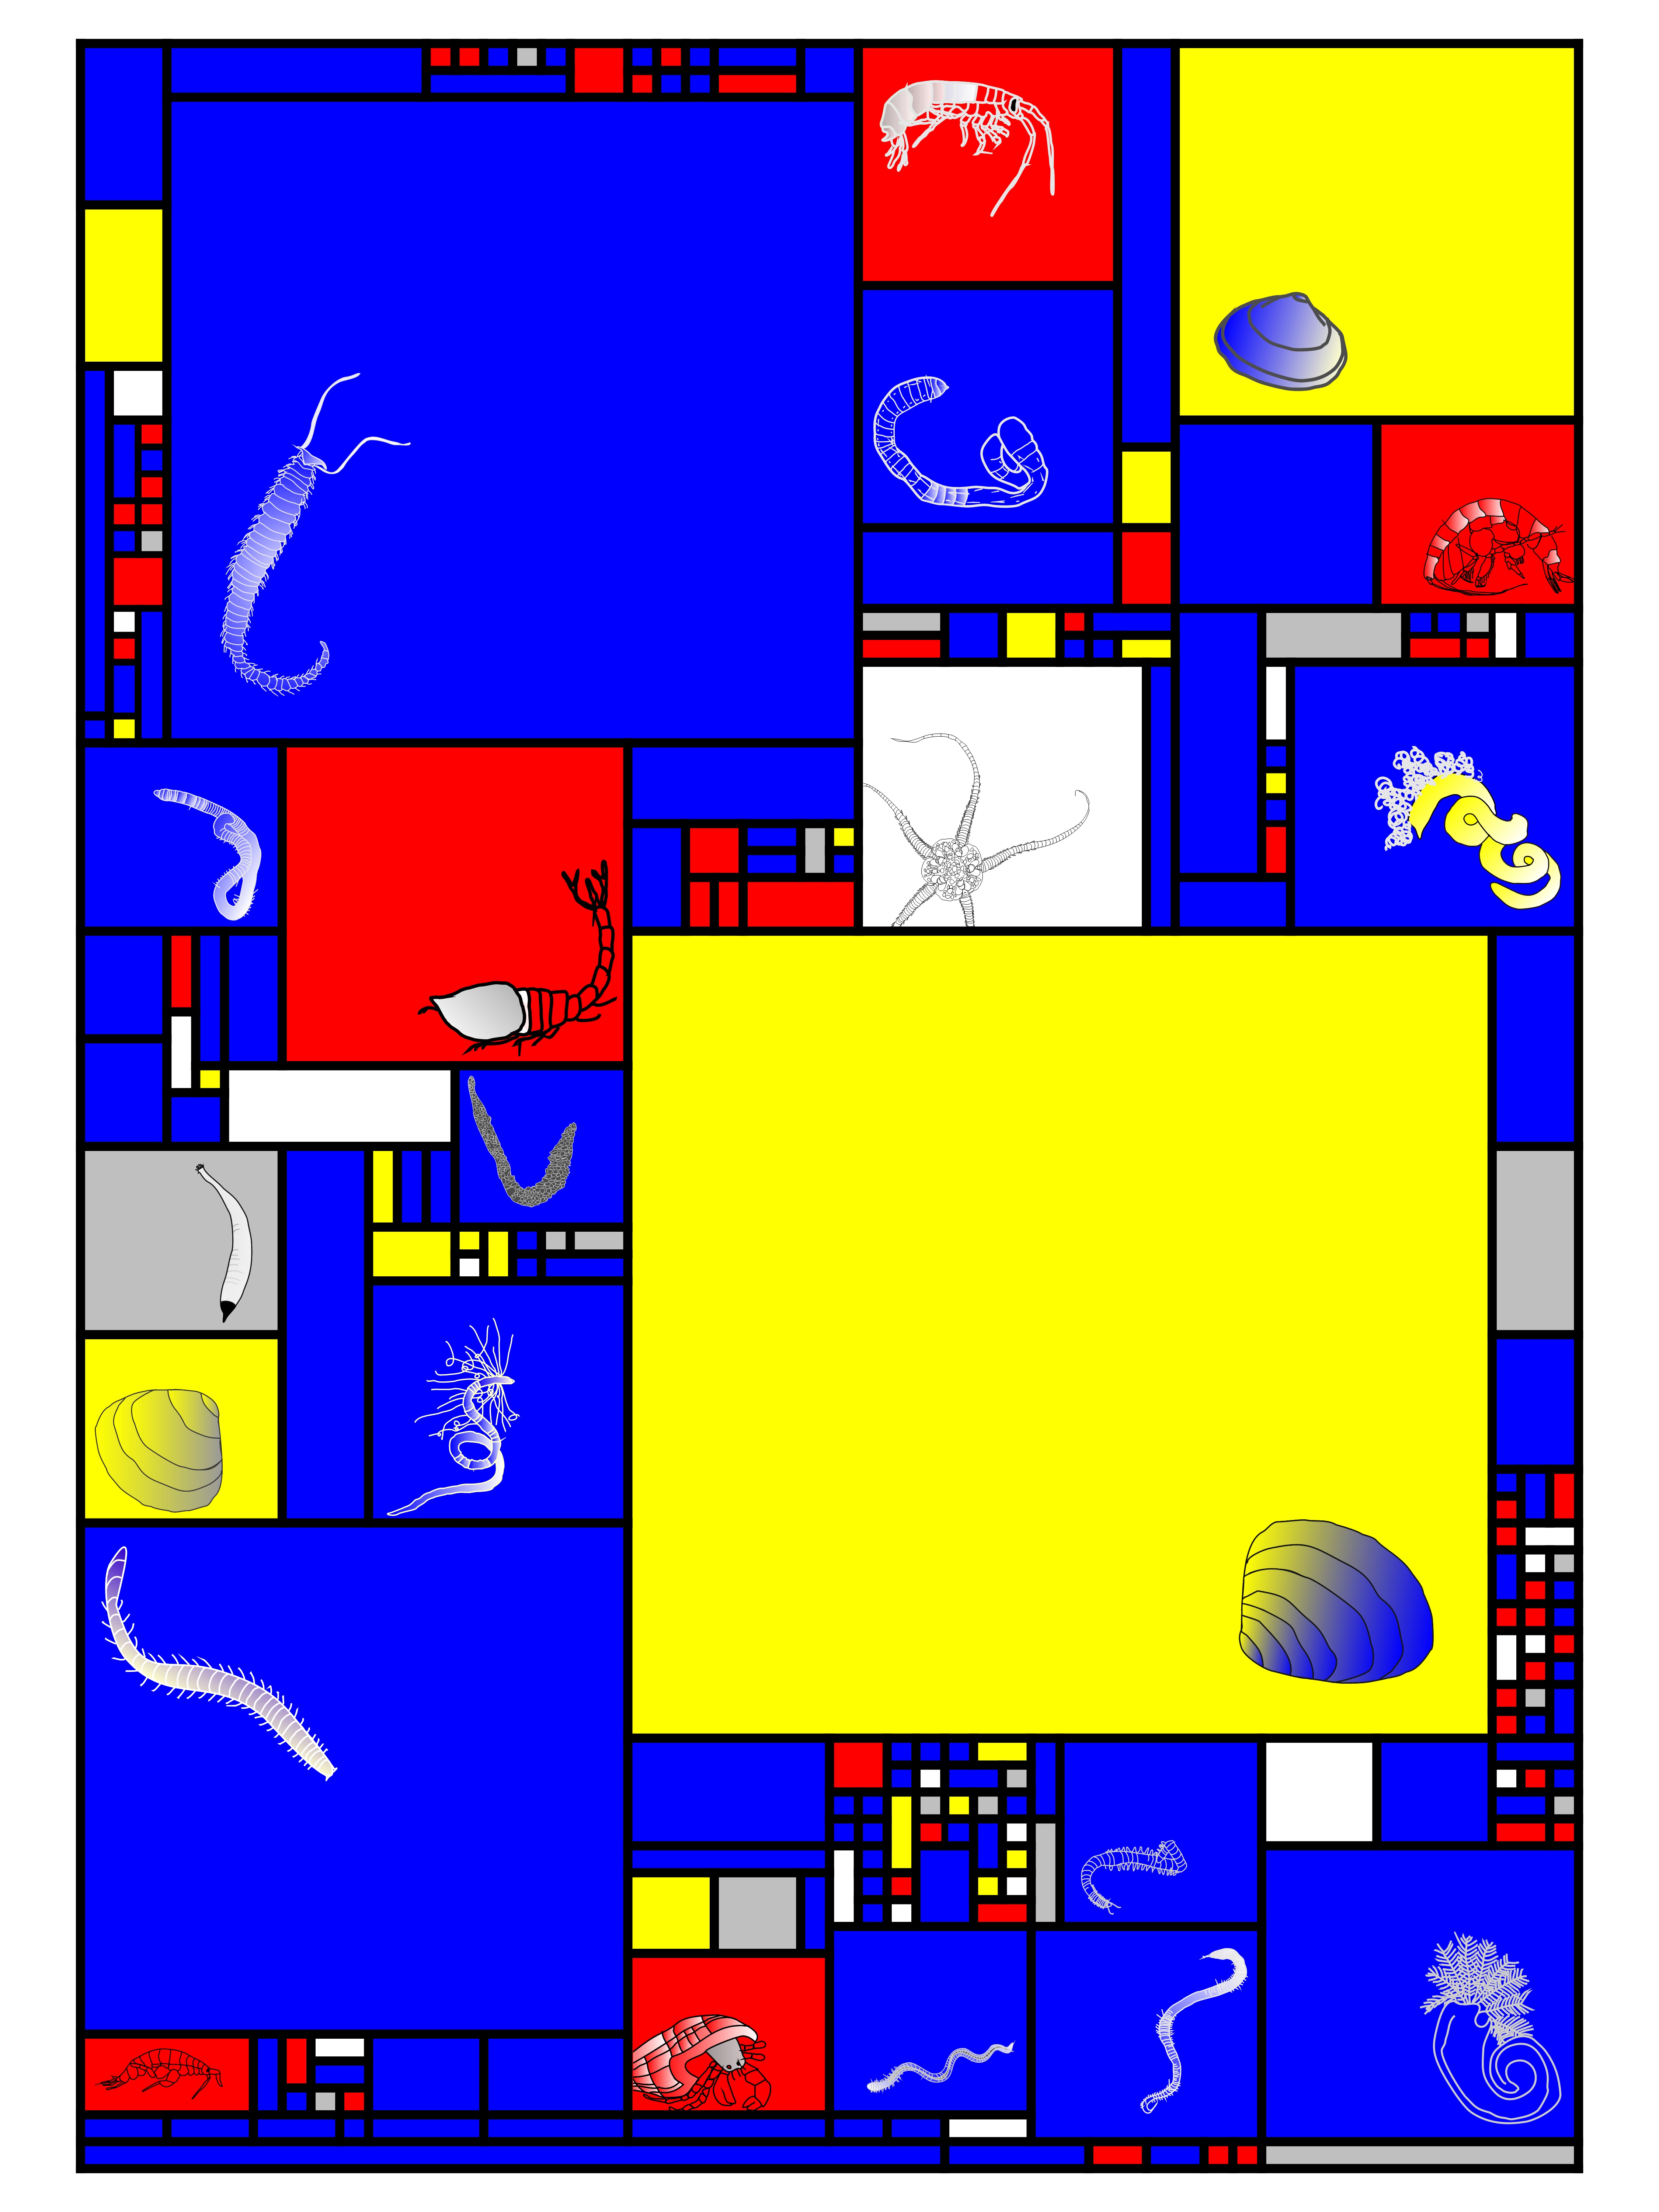 |
|
Alaa Abi Haidar University of Pierre and Marie Curie, dEYEversity The two contrasted eyes are composed of the same ingredients and diversity of eyes, ad infinitum. The artist owns all images’ rights. . Featured at La Nuit de la Photographie Contemporaine and soon in a gallery . As for the technique, I developed image processing algorithms to crop the eyes from the 1001faces.org project to have them automatically reassembled in this mosaic using another algorithm that optimizes the images' position according to the best matching pixel intensities | 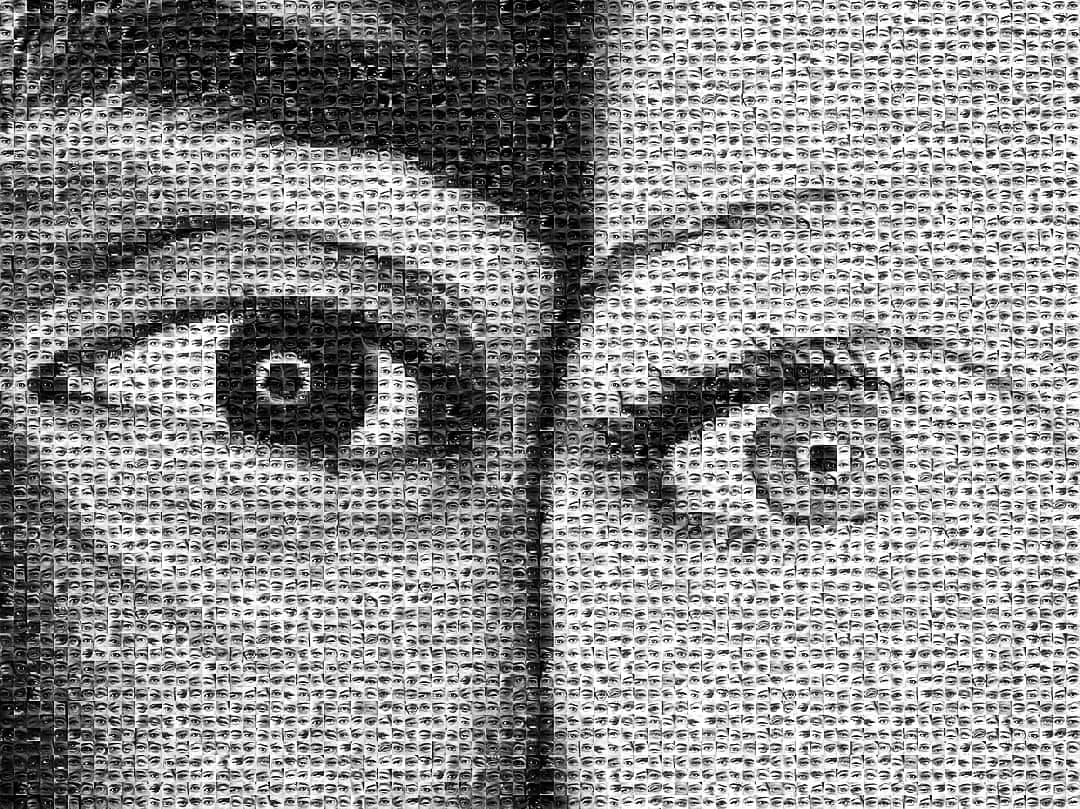 |
|
Dan Tulpan National Research Council Canada, HAR1 non-coding RNA secondary structure evolution from chimp to human Human accelerated region (HAR) non-coding RNAs are a new class of RNAs that show accelerated nucleotide substitutions rates compared to other vertebrates. Located at the end of chromosome 20 in humans, the HAR1 ncRNA in particular, shows a significantly higher substitution rate than the other known HARs (a total of 202). Structural biology studies of HAR1 ncRNAs [12–16] in higher order vertebrates include various models of their predicted and experimentally determined secondary structure. Here, we use the Circular Secondary Structure Base Pairs Probabilities Plot to highlight the major similarities and differences among predicted secondary structures for chimp, Denisovan and human. The plot efficiently represents both, the minimum free energy secondary structure and the base pair probabilities for an RNA sequence and significantly simplifies the interpretation, analyses and comparisons of RNA secondary structures, thereby making evolutionary and energetic transition results more easily understandable. Previous work on HAR1 [Costa et al., 2018] constructed a model showing that the most likely last step in turning the ancestral primate HAR1 into the human HAR1 was exactly the substitution at position 47 that distinguishes the modern human HAR1 sequence from that of the Denisovan, an archaic human, providing independent support for our visualizations. We can also notice in the CS2BP2-Plot that the human secondary structure is by far the most stable with a total MFEhuman = -33.5 Kcal/mol out of all three HAR1 structures (MFEchimp = -20.0 kcal/mol; MFEDenisovan = -32.1 Kcal/mol) given the absence of stronger base pairing probabilities (low number of orange and green arcs). | 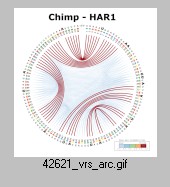 [Video] |
|
Somnath Tagore BAR-ILAN UNIVERSITY, When Mathematics Outsmarts Cancer Mathematics has become a powerful tool in cancer research. Cancer complexity is very well suited to mathematical models, thus providing opportunities for novel strategies. This abstract art illustrates how mathematics helps in overcoming cancer. It represents two trees, one cancer tree and the other normal tree, linked by a human face, drawn using numerical values. Mathematics contributes to cancer research by elucidating quantitative predictions that can be further validated. These include addressing initiation, progression and metastases of tumors, as well as treatment and resistance strategies. Thus, mathematics in cancer studies provides understanding of the dynamics of disease going beyond the contemporary techniques. | 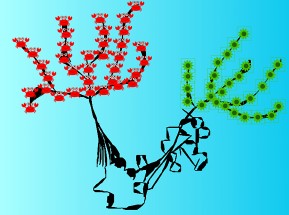 |
|
Marwan Abdellah École polytechnique fédérale de Lausanne (EPFL), In Silico Neocortical Column The image shows a selection of few neocortical neurons digitally reconstructed and simulated by the Blue Brain Project (BBP). The colors of the selected neurons map to their layer in the neocortical column that is composed of six layers. The morphological skeletons of the neurons are used to reconstruct three-dimensional surface mesh representations per neurons. Each neurons is then statistically positioned in the column. The image is used to verify the layer structure and the distribution of the morphologies in the neocortical column. Colormap: Green: layer 1, Blue: layers 2/3, Yellow: layer 4, Rose: layer 5, Light Blue: layer 6. | 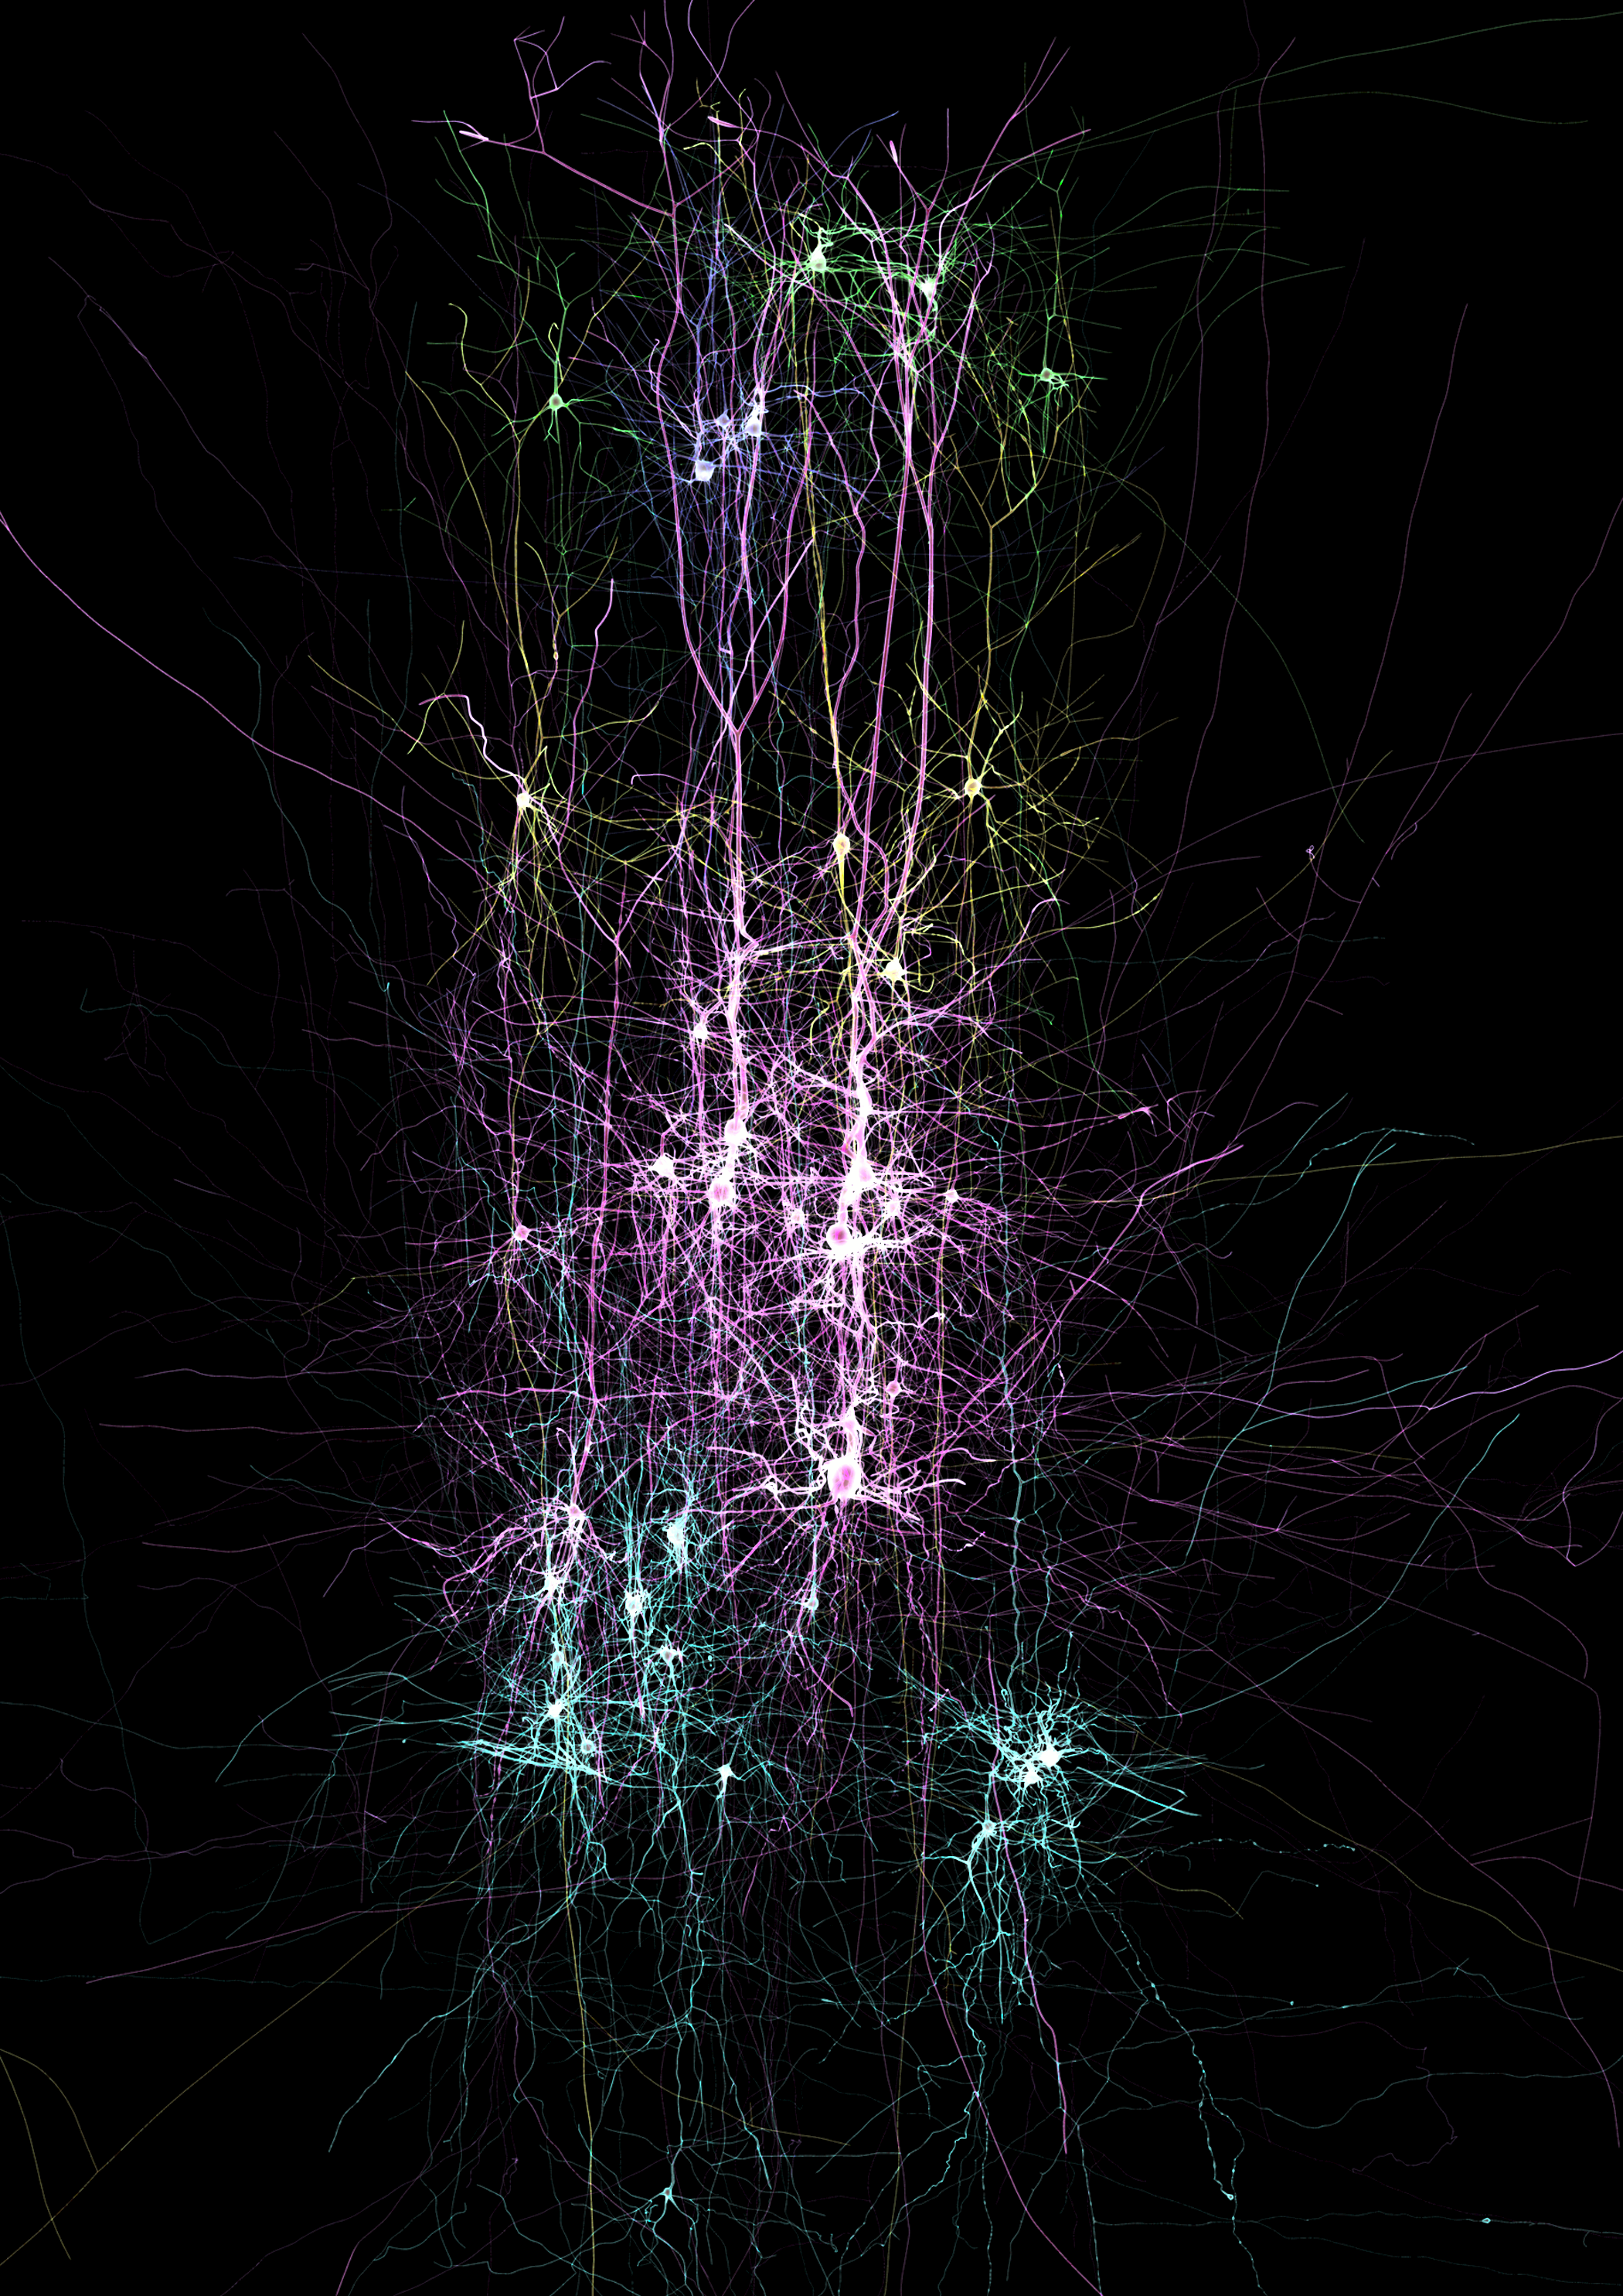 |
|
Laura Mitchell University of Cambridge, Sorting spaghetti - clustering single-domain antibody H3 loops Single-domain antibodies (SdAbs, or 'Nanobodies') are becoming increasingly important molecules for therapeutic, biotechnological and research applications. A notorious challenge in modelling antibody structures is accurate prediction of the hypervariable CDR H3 loop structure from sequence. This is perhaps an even greater challenge for single-domain antibodies from camelid species, since these antibodies use H3 loops with even greater sequence and structural variation than in classical antibodies. This graphic illustrates clusters of single-domain antibody structures, assembled by measuring backbone torsion angles over aligned sections of H3 loops, from 187 crystal structures. Clusters are arranged in order from 'alignable' to 'disordered', with the alignable region in each cluster highlighted. The majority of H3 loops fold back against the framework, while some loops extend in a finger-like protrusion. The inset matrices represent the distribution of amino acids sampled across N- and C-termini of loop sequences belonging to each cluster - information that we hope will be useful in predicting unknown SdAb H3 loop structures from sequence. | 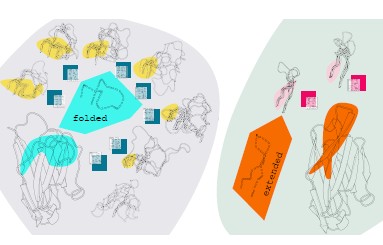 |
|
Marwan Abdellah Ecole Polytechnique Federale de Lausanne, Illuminating the Cortical Column In Silico The Blue Brain Project (BBP) aims to reconstruct digital models of the brain circuitry and simulate its functional aspects to reverse engineer the mammalian brain and understand its underlying complexity in health and disease. We presented NeuroMorphoVis; a collaborative framework that is used to analyze and visualize the morphological skeletons of neurons upon their reconstruction from optical microscopy stacks. The image simulates the process of illuminating a fluorescent-labeled neuron in the neocortical circuitry using a specific excitation wavelength. The neuron emits fluorescent light (green) upon the excitation. The neocortical circuitry model is reconstructed and rendered relying on our framework (NeuroMorphoVis). | 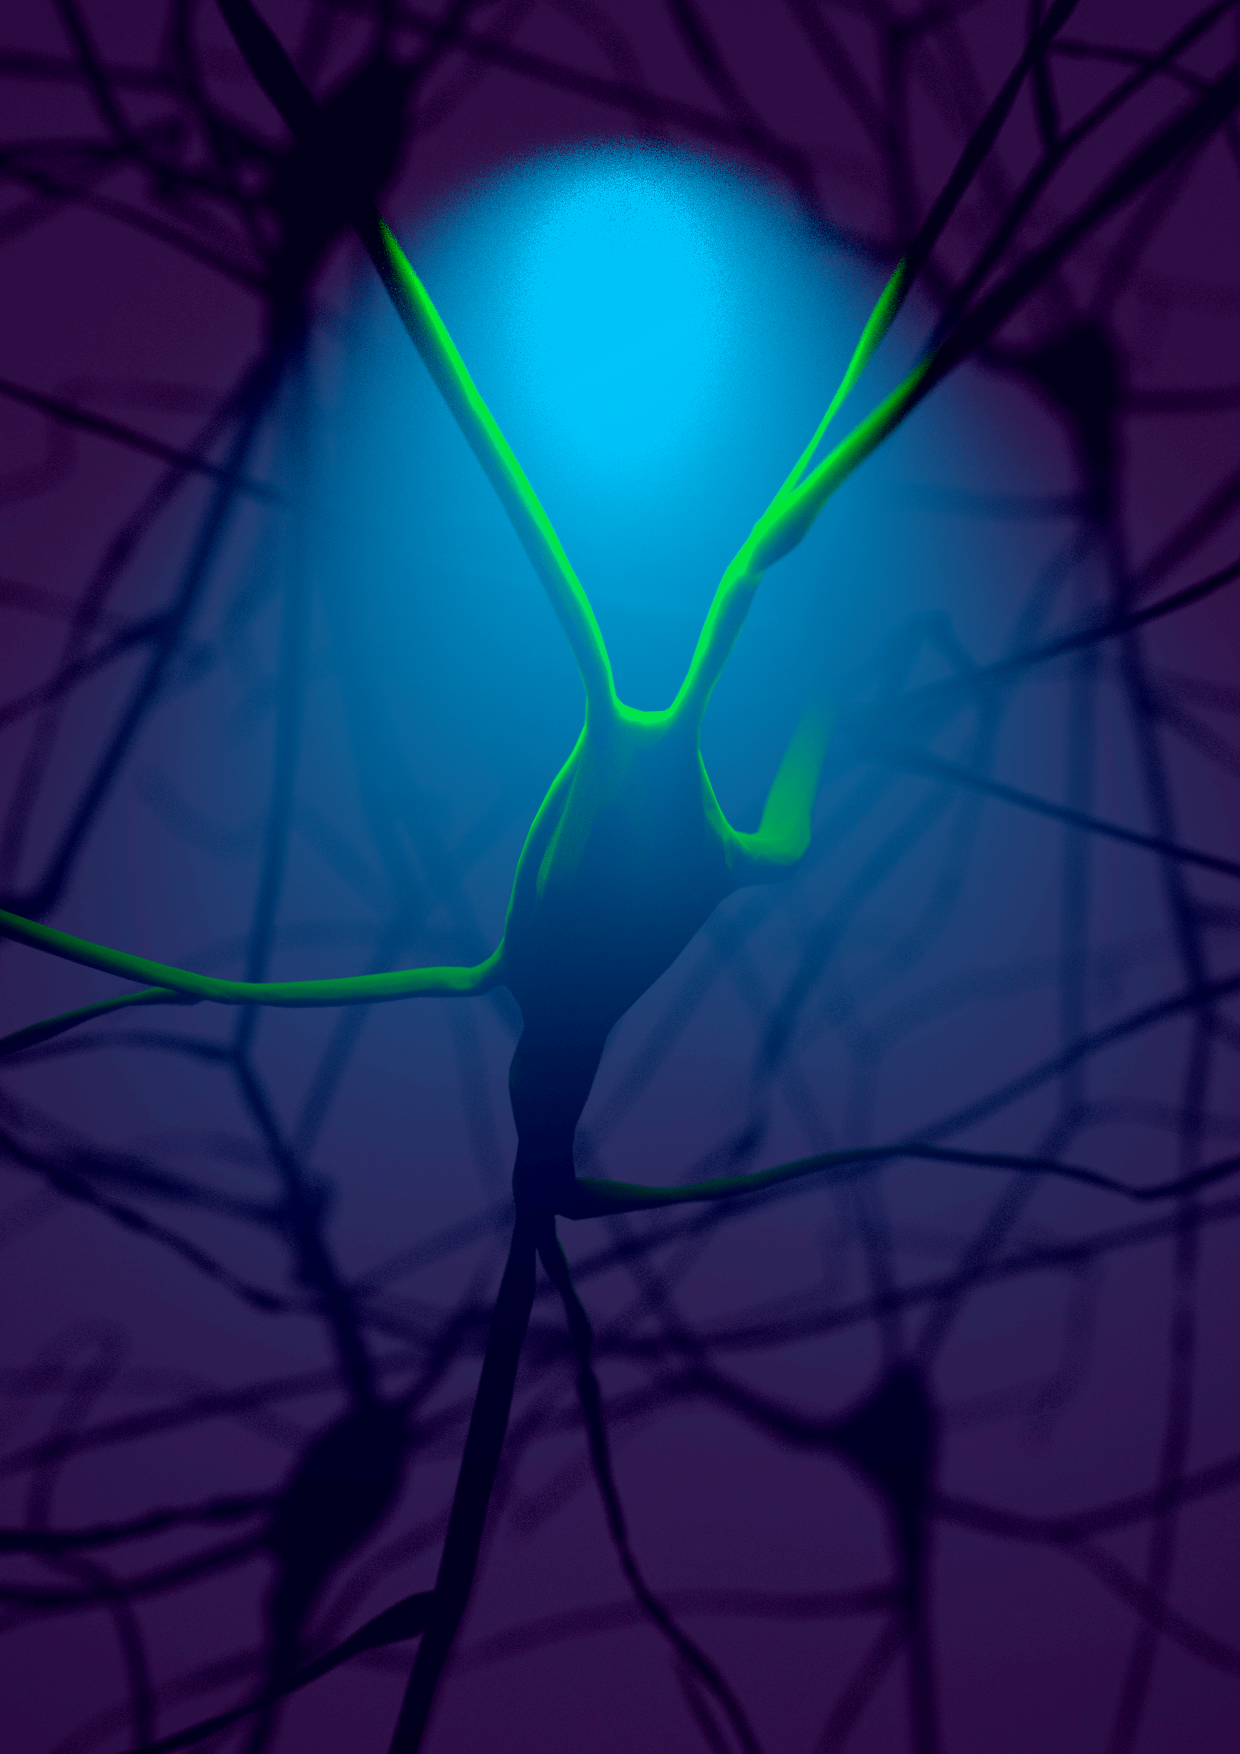 |
|
Marwan Abdellah École polytechnique fédérale de Lausanne, In Silico Golgi Staining of Digitally Reconstructed Neocortical Circuitry This artwork represents a physically-plausible simulation of imaging a neocortical tissue sample stained with Golgi's stain using brightfield microscopy. The tissue model is reconstructed by NeuroMorphoVis, a vollaborative framework for analysis and visualization of neuronal morphologies from wet lab experiments. The image is generated using physically-based rendering and simulation of the optical pipeline of the brightfield microscope. | 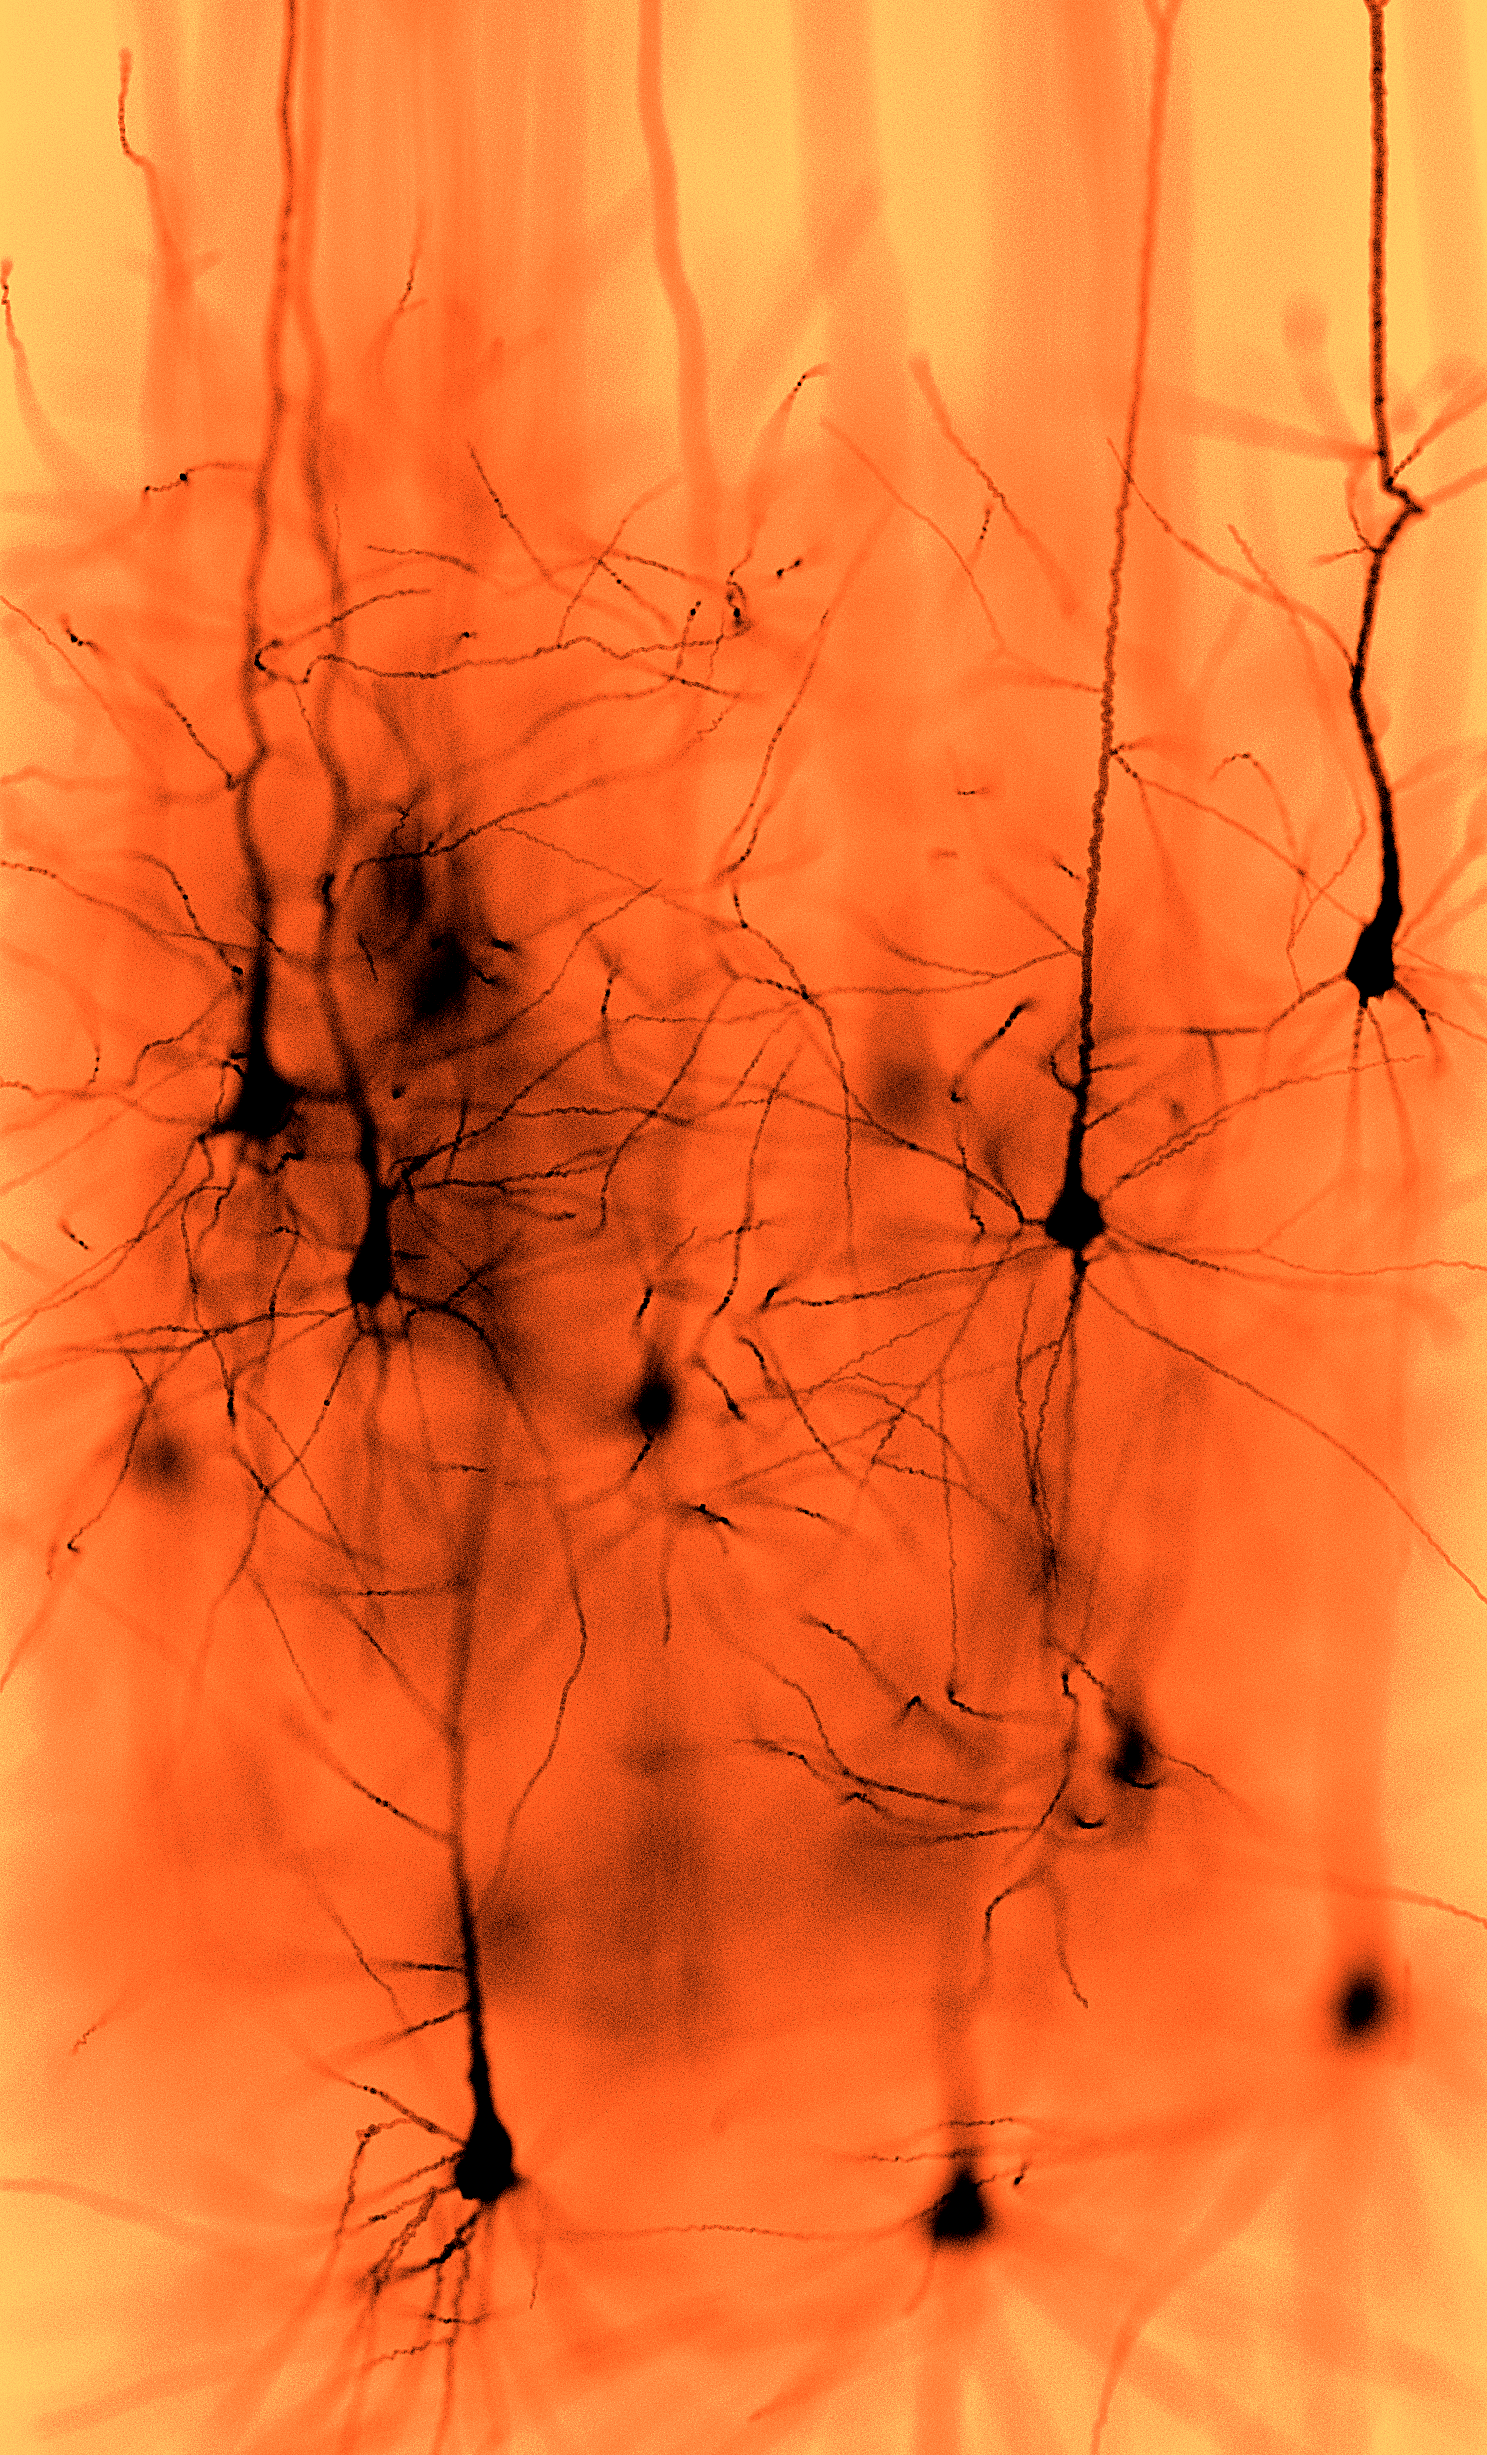 |
|
Rohit Suratekar National Centre for Biological Sciences - TIFR, India, Assembling biological knowledge through mathematics This artwork represents the process of inspecting the cell by building mathematical models. The model building process is central to computational biology and attempts to explain various biological phenomena, through the magnifying glass of mathematics and computer science. We build one model or the other by assembling our current knowledge and using it to further understand the complex biological systems. Mathematical models provide valuable predictions to complement our knowledge from experiments. I have built the mathematical model of lipid signalling in Drosophila phototransduction. This signalling cascade has been studied for a long time, but we still lack in our understanding of how this process is regulated. It is triggered by visual stimulus and the information is then transferred inside the cell in the form of electrical response. Our mathematical model provides new insights into regulation of lipid signalling. This illustration nicely demonstrates the ability of a mathematical model to control the various parameters of a signalling cascade, in order to explain experimental observations. |  |
|
Madhushree Kamak Tata Institute of Fundamental of Research, Concerted Creation Creation of intracellular compartments such as synaptic vesicles is process that usually involves the effort of several molecules. Their functions are to some extent synchronised with each other. JIP3/UNC-16 is a MAPK-scaffolding protein with roles in protein trafficking. Our work Choudhary and Kamak et al 2017 shows that UNC-16 is present on the Golgi and is necessary for the polarized distribution of synaptic vesicle proteins (SVPs) and dendritic proteins in neurons. It excludes Golgi enzymes from SVP transport carriers and facilitates inclusion of specific SVPs into the same transport carrier. The SVP trafficking roles of UNC-16 are mediated through LRK-1. UNC-16, through LRK-1, also enables Golgi-localization of the μ-subunit of the AP-1 complex. AP1 regulates the size but not the composition of SVP transport carriers. Additionally, UNC-16 and LRK-1 through the AP-3 complex regulates the composition but not the size of the SVP transport carrier. This art work aims to show that UNC-16 and its downstream effectors, LRK-1 and the AP complexes function at the Golgi and/or post-Golgi compartments to control early steps of SV biogenesis. Each molecule of these proteins act to add or remove components form the nascent vesicle in the end working concertedly towards the creation of the perfect vesicle. | 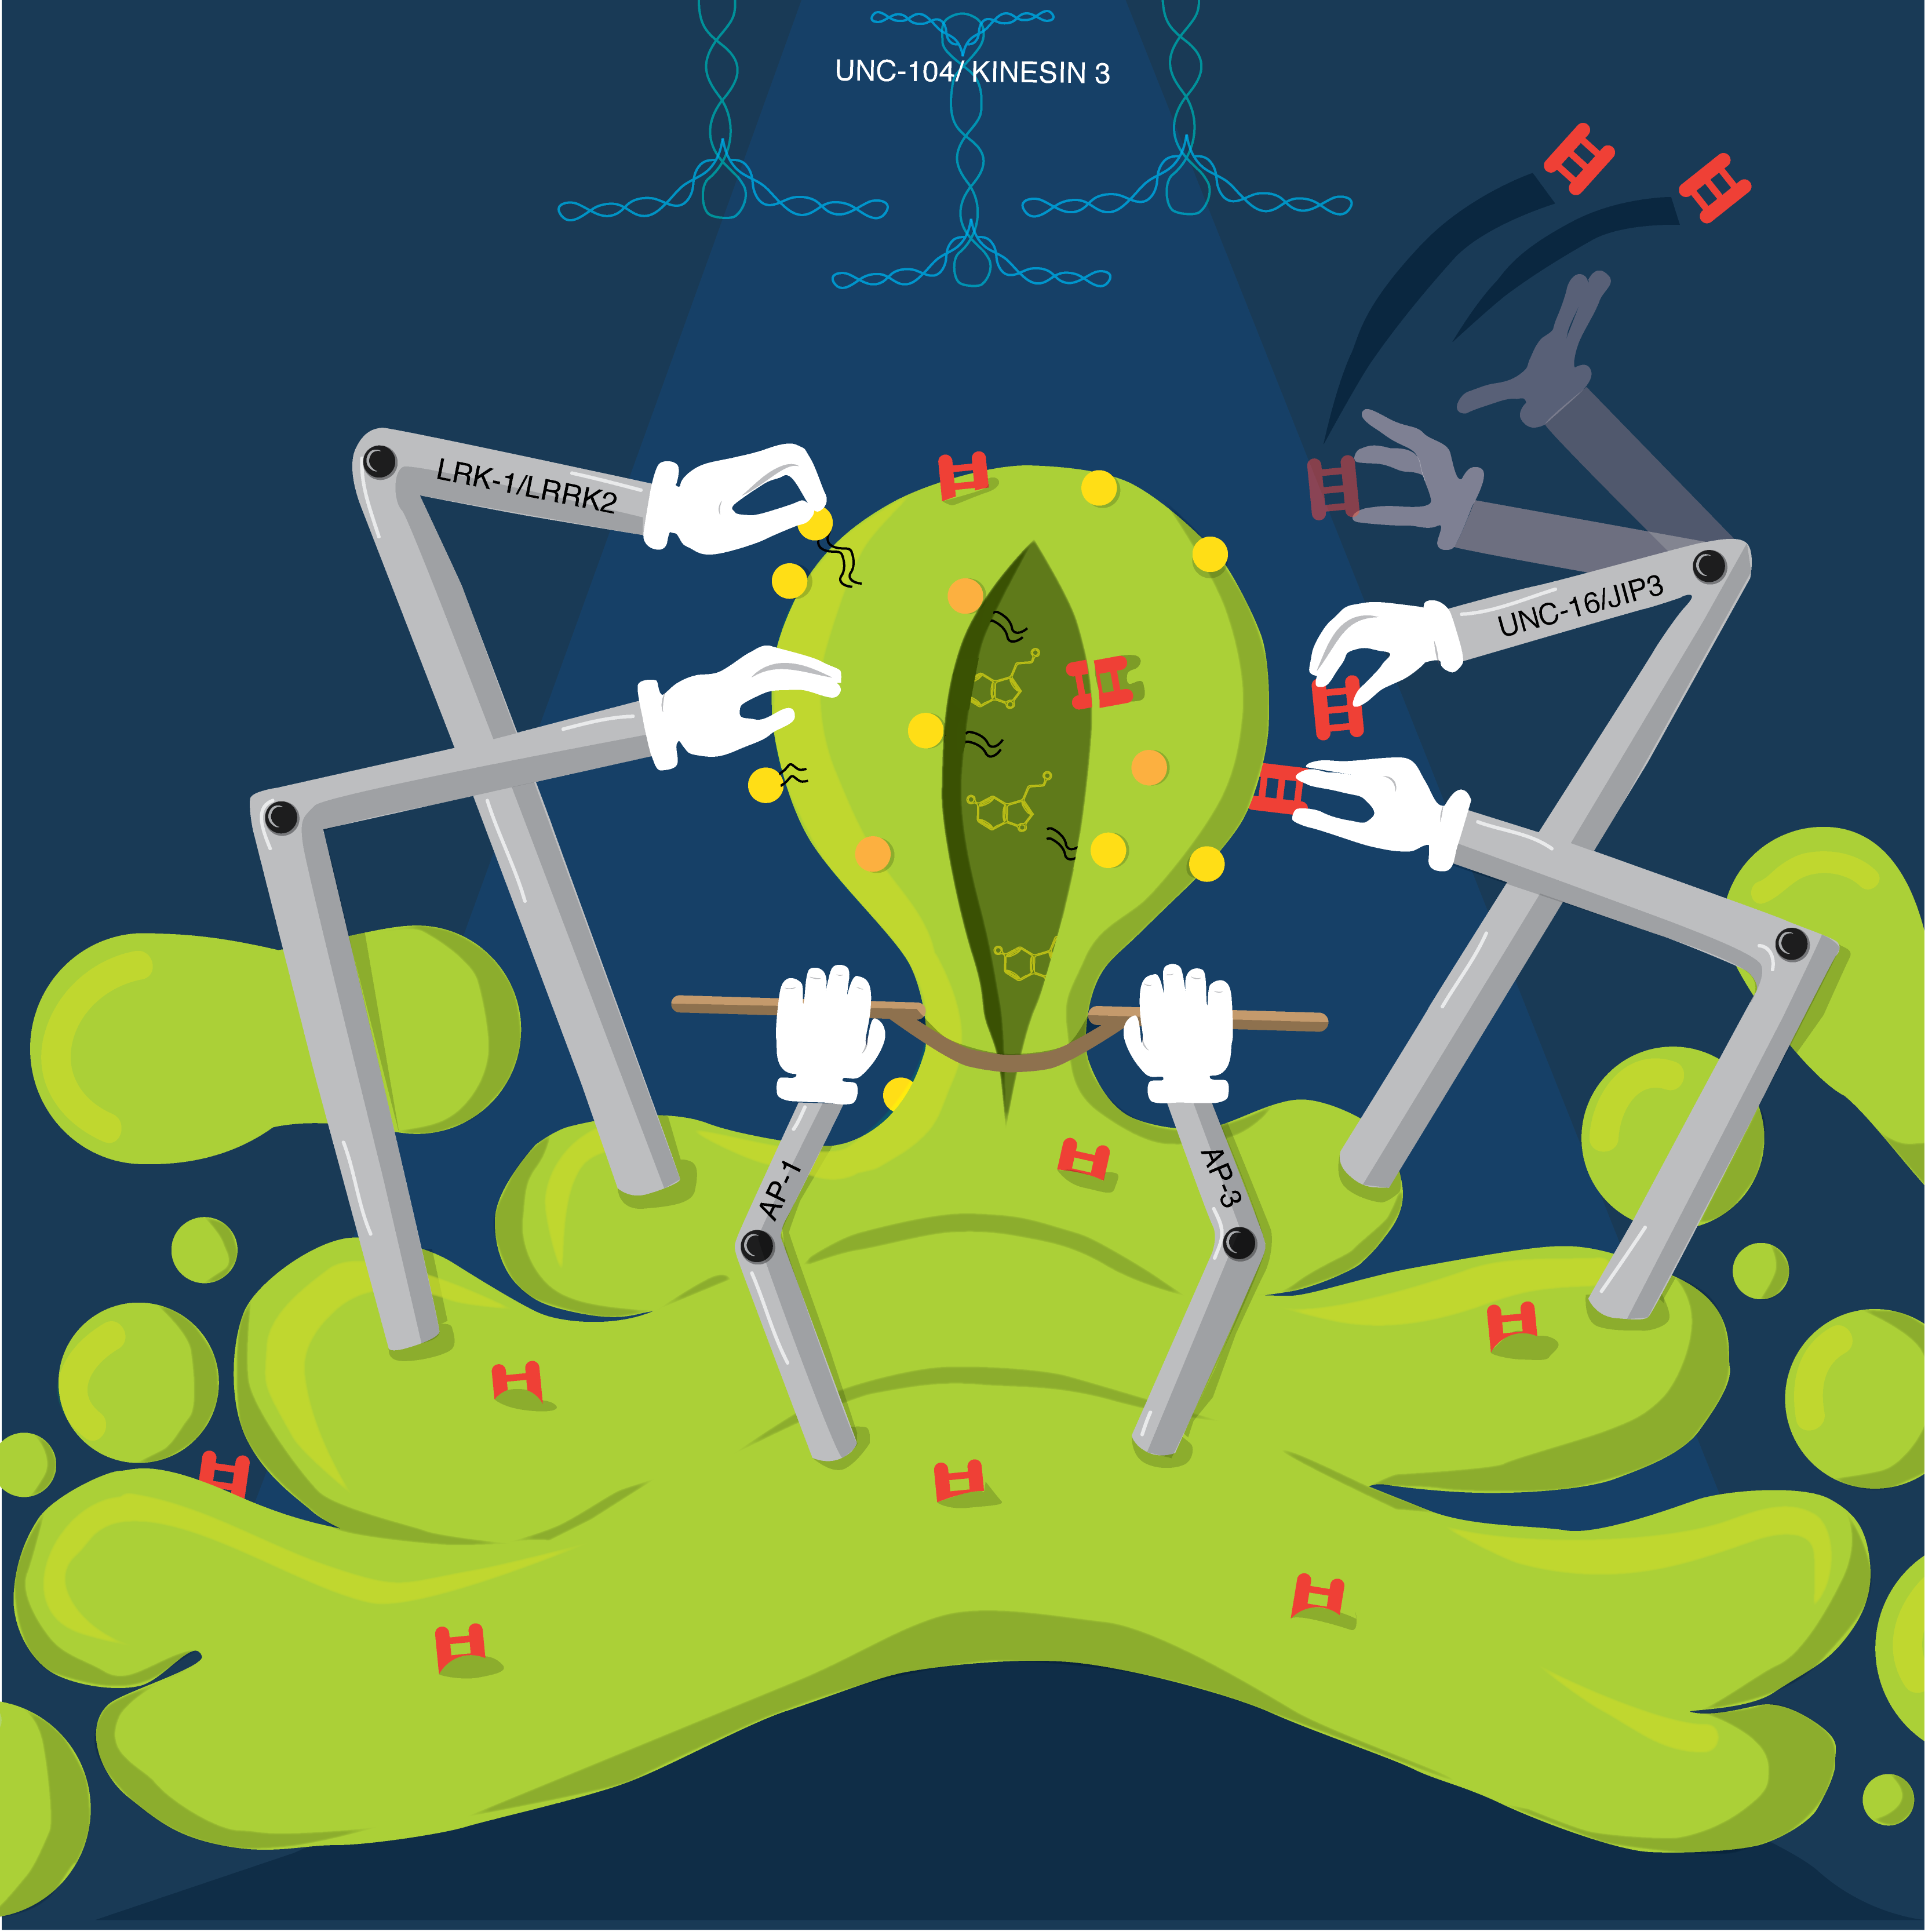 |
|
David Twesigomwe Uganda Virus Research Institute, Rosette Karungi Kwamya, Uganda Virus Research Institute, Uganda Ritah Nabunje, Uganda Virus Research Institute, Uganda Combating Antimicrobial Resistance: The Role of Whole Genome Sequencing Antimicrobial resistance (AMR) has become a serious global health challenge so much so that a lot of resources are being availed to preserve the effectiveness of antimicrobials for the future. The threat created by AMR is also being compounded by the current low drug discovery success rates. Innovation of novel, effective and highly accurate diagnostics is the popular solution being explored by scientists (https://longitudeprize.org/challenge). This illustration shows the progression and utility of various diagnostic methods as “weapons” developed over time by scientists aiming to curb AMR. Phenotypic drug susceptibility testing using disk-diffusion and genotypic methods like polymerase chain reaction are already established albeit the former being slow and both being reliant on prior knowledge of the resistance pattern of the suspect pathogens. There are of course more methods being used to “combat” AMR. Among these, whole genome sequencing (WGS) has emerged as an essential tool with the potential to alleviate AMR from various fronts. This includes applications in development of novel highly sensitive and specific diagnostics, studying the molecular evolution of drug – resistant infectious microbes, improving surveillance, and in research aimed at control of pathogens that cause nosocomial infections. However the cost and ease-of-use of WGS technologies is still a major challenge in addition to difficulty in estimating the minimum inhibitory concentration of antimicrobials in use. | 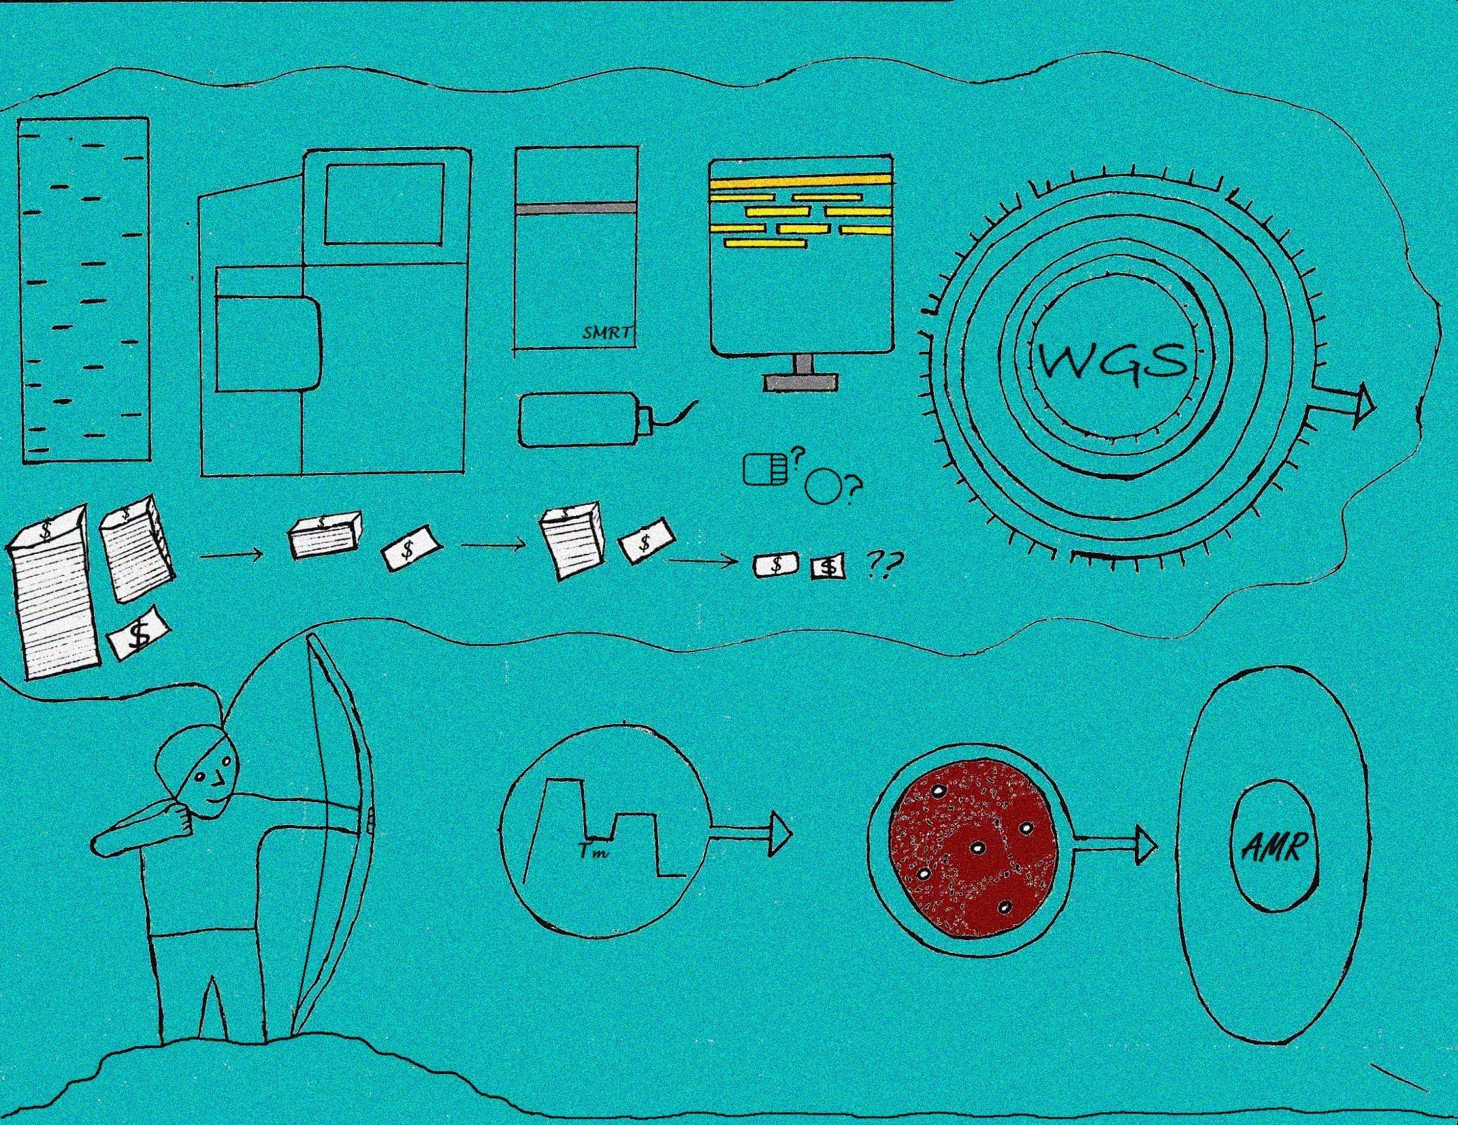 |
|
Victor Padilla-Sanchez Washington Metropolitan University, Bacteriophage T4 Description: Model of bacteria during infection by T4 viruses (left) where one cell (2 μm x 0.5 μm) is enlarged to show the infection and bacterium details including a polyribosome, T4 DNA packaging, nucleoid and phages during attack. The T4 bacteriophage (200 nm x 90 nm) model (middle) shows its molecular architecture counting about 50 proteins where the packaging machine (right) is composed of dodecameric portal protein (PDB:3JA7 on top) and pentameric ATPase motor with 2 domains (PDB: 3EZK on bottom). See Journal of Virology 2012 issue 8 cover and featured article. Image: This image is a composite of 3 models (bacteria group during infection, enlargement of T4 bacteriophage and packaging machine) constructed with the molecular visualization software UCSF Chimera where the only components are X-ray structures (PDBs) and cryoEM reconstructions (EMDBs). Author: I am Victor Padilla-Sanchez, PhD. I have been working on the structure and function of the portal protein gp20 of Bacteriophage T4 for a decade while my interests are in Structural Bioinformatics, Virology, and Molecular Modeling. Contact: https://www.drvictorpadillasanchez.com |  |