


Art and Science Exhibition
ISMB/ECCB 2017 brings together scientists from a wide range of disciplines, including biology, medicine, computer science, mathematics and statistics. In these fields people are constantly dealing with information in visual form: from microscope images and photographs of gels to scatter plots, network graphs and phylogenetic trees, structural formulae and protein models to flow diagrams; visual aids for problem-solving are omnipresent.
Some of the works of the first such exhibition at the ISMB 2008 in Toronto combine outstanding beauty and aesthetics with deep insight that perfectly proves the validity of our approach or goes beyond the problem's solution. Others were surprising and inspiring through the transition from science to art, opening our eyes and minds to reflect on the work that we are undertaking.
The Art & Science Exhibition 2017 presents the artworks that have been generated as part of research projects. They are also soliciting images resulting from creative efforts that involve scientific concepts or employ scientific tools and methods.
Art in Science Printing Size:
When preparing your accepted art please note that your print should not exceed the following dimensions 0.95 m (wide) x 1.30 m (high) View a diagram of the poster board in pdf format here.
Click image to download larger file
|
Kazuharu Arakawa Keio University, SEM of Extremotolerant tardigrade Ramazzottius varieornatus Tardigrades, commonly known as water-bears, are microscopic animals occupying distinct phylum Tardigrada, and are found throughout the globe, from rooftops of urban houses to Antarctica, and even in deep sea basin. Majority of the limno-terrestrial tardigrades can withstand complete dehydration by turning into a “tun” state, at which tardigrades can withstand extreme environments such as extremely high and low temperatures, pressure, and radiation. In fact, tardigrades are the first animals that survived exposure to space vacuum and solar radiation. We have identified a tardigrade with strongest extremotolerance, Ramazzottius varieornatus, and named the isolated strain Yokozuna-1, borrowing from the rank name of grand champion Sumo wrestlers. We are studying the molecular mechanisms behind their exremotolerant abilities through multi-omics analyses, with high-quality genome sequencing and assembly and transcriptome, proteome, and metabolome analyses. | 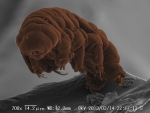 |
|
Teal Guidici University of Michigan, Common structure and individual modulation Identifying and characterizing patterns of co-variation/co-expression between biomolecules is a common aim in bioinformatics today. These patterns of association between biomolecules can be described in terms of their covariance matrix. We have developed a method to characterize the covariance structure of related datasets (such as those from a 2x2 factorial design experiment) in a way that captures both the shared structural elements, and the condition specific differences. We use all of the datasets to estimate the common covariance structure, while each individual dataset is used to estimate the condition specific modulation of that structure. These estimates can be used to visualize the results in the form of heatmaps (showing the reconstructed covariance matrices, created from the estimates) and bar charts (created by taking the ratio of the condition specific modulations for any two conditions of interest). Presented in this image are the results from applying the method to a controlled feeding study on humans. Subjects were fed two distinct diets in succession, each for 21 days, and had their plasma lipidomes assayed at three time points in each diet. The common structural elements across all 6 datasets can be seen in the pattern of alternating red and blue blocks in the heatmaps. Each bar chart compares two conditions of interest, with longer bars pointing towards the condition with stronger patterns of association. More technical details can be seen in the poster “A factor analysis based method for characterizing the covariance structure of related datasets” | 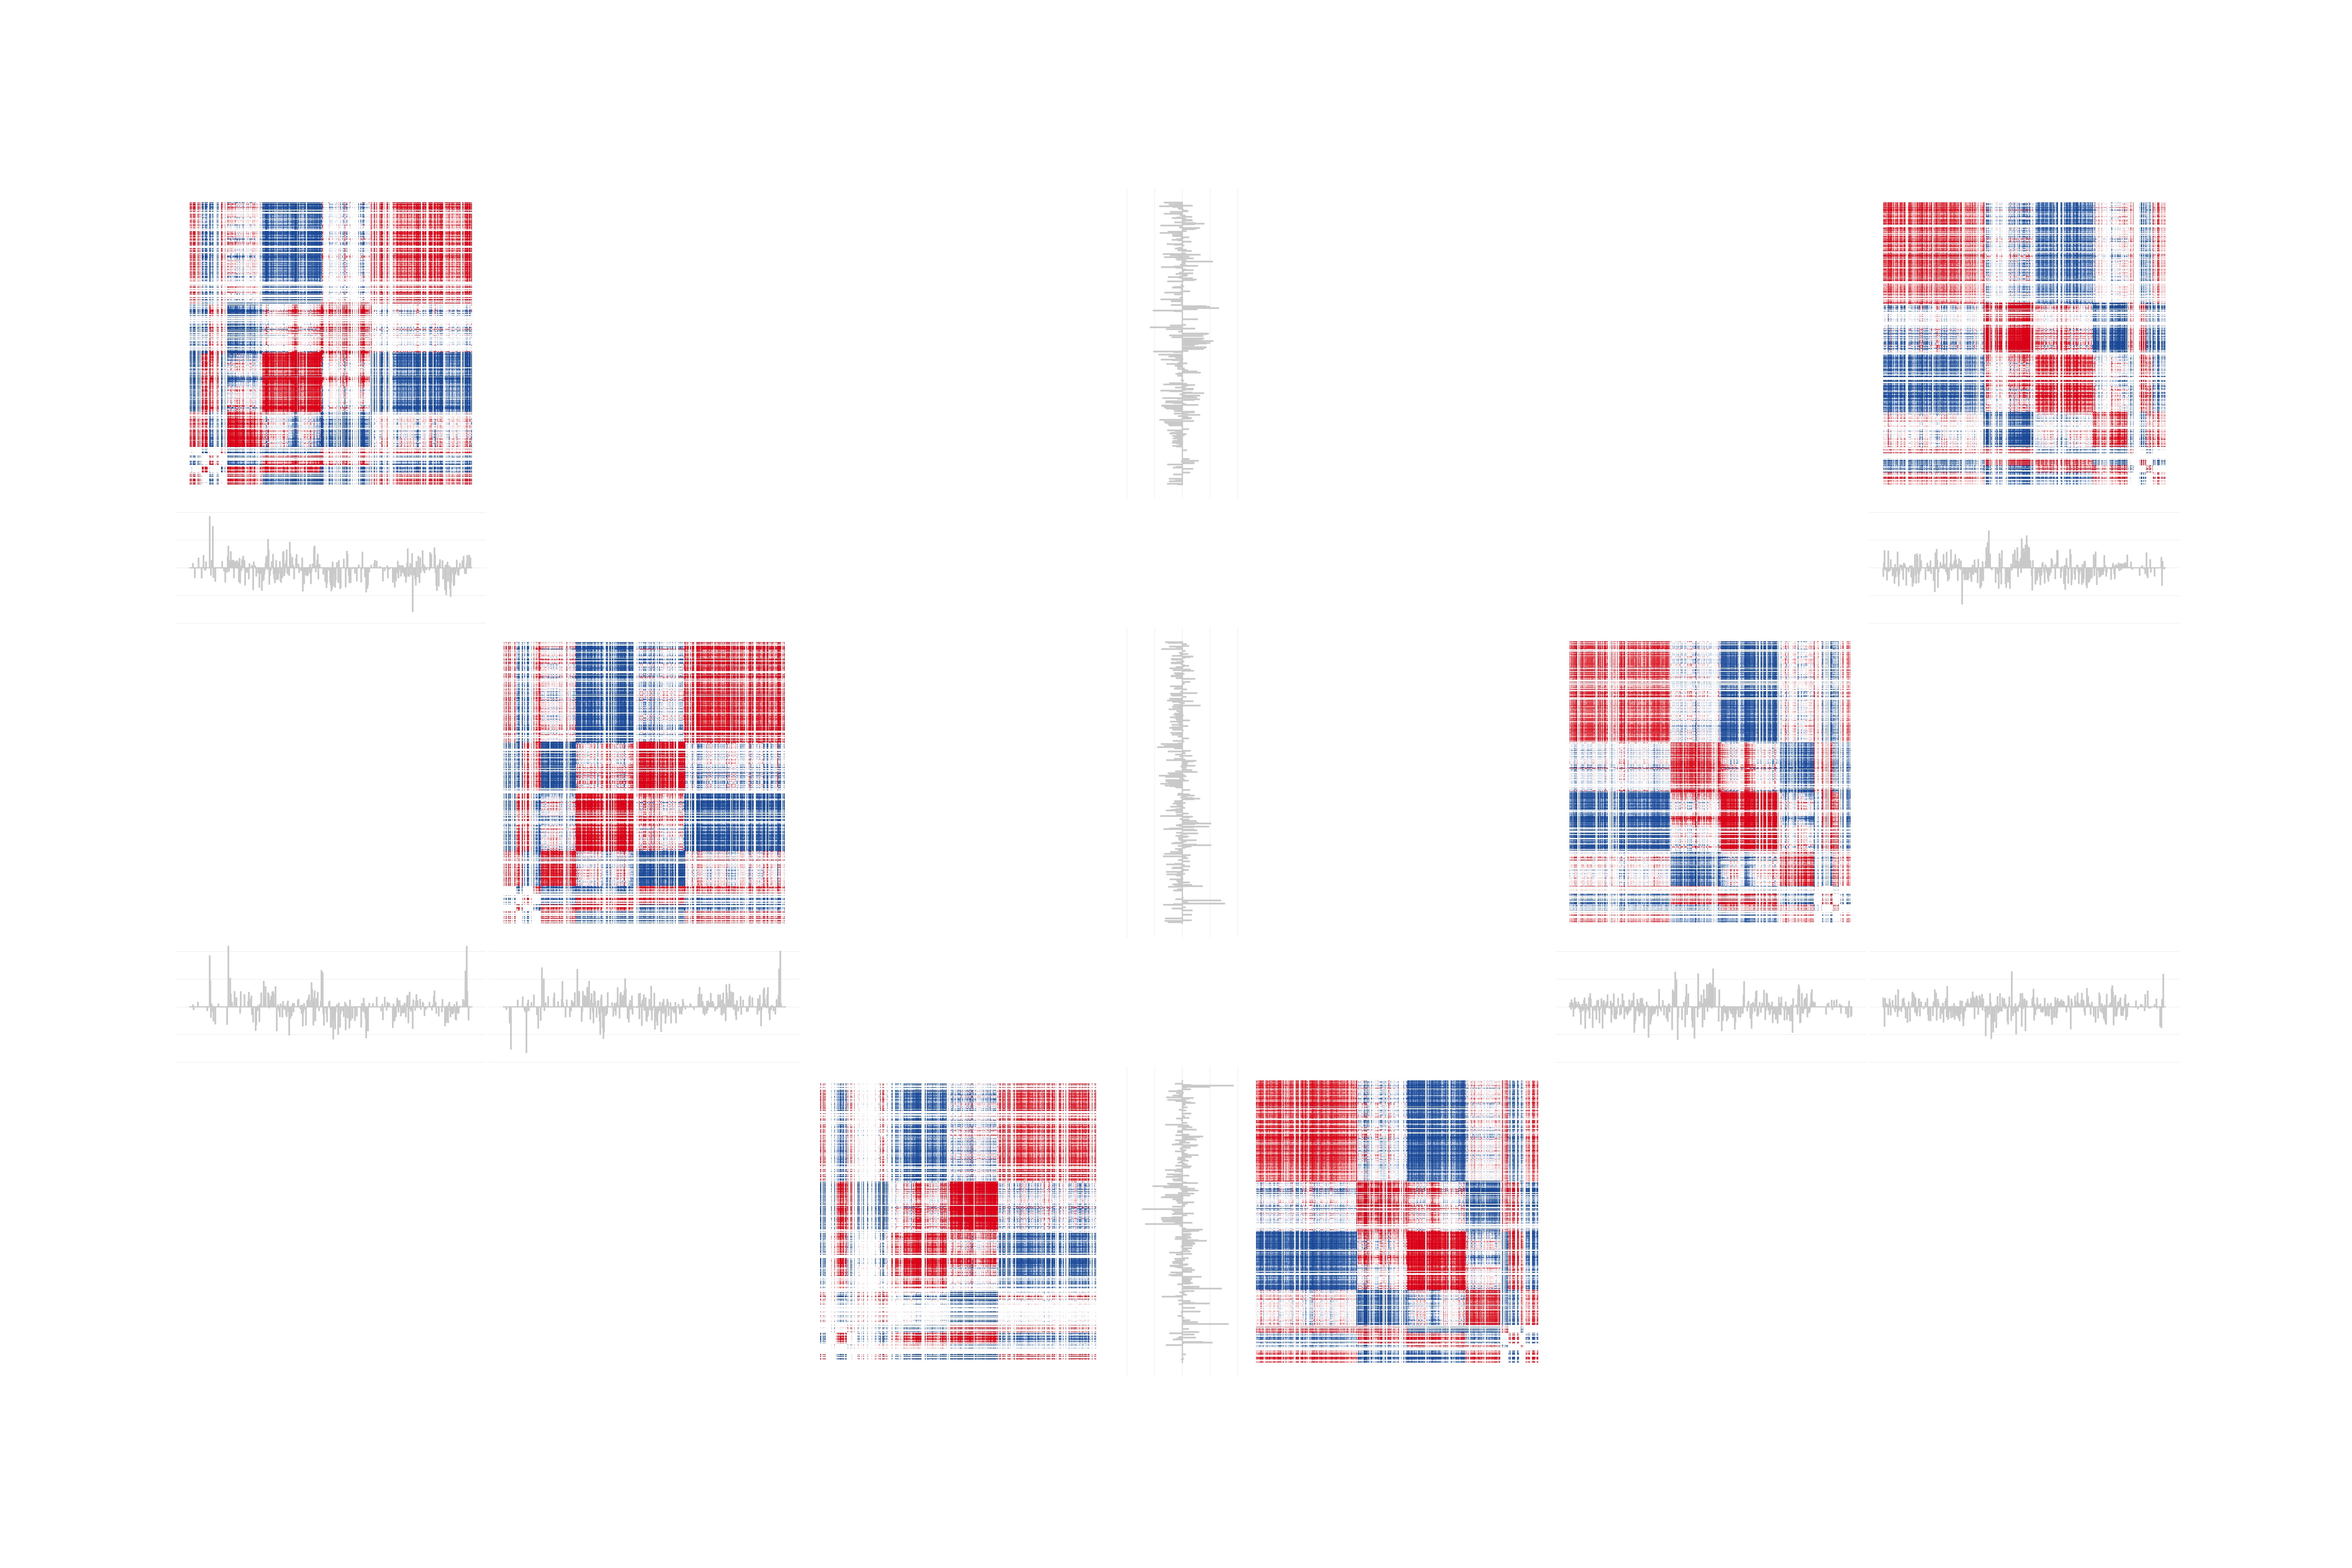 |
|
Teal Guidici University of Michigan, Hyperbolic Plane 1 Hyperbolic Plane 1, illustrates the concept of hyperbolic geometry through knitting. In hyperbolic geometry, the plane has negative curvature (as opposed to a Euclidean plane with no curvature, or the plane in spherical geometry, where it has positive curvature). One simple method of representing a hyperbolic plane in our 3-dimensional Euclidean space is the {3,7} polyhedral model, in which equilateral triangles are put together 7 at a vertex. To imagine how this might work, think of a regular hexagon, made of 6 equilateral triangles. The addition of the 7th triangle about the same vertex causes the surface to bow and wobble, giving it its negative curvature. Hyperbolic Plane 1 is constructed out of 8 identical {3,7} knit hyperbolic planes, which are sewn together, 3 to a vertex, creating a tessellation of the hyperbolic plane. The planes are knit in 50% merino wool and 50% silk yarn, giving the work an unexpected flowing nature in contrast to more common models of the hyperbolic plane. In addition to being beautiful and having many applications across theoretical mathematics, hyperbolic geometry has been be used as a framework to study the structure and function of complex networks, proposed as a model for the structure of some biological materials and use to describe the structure and properties of crystallographic materials. | 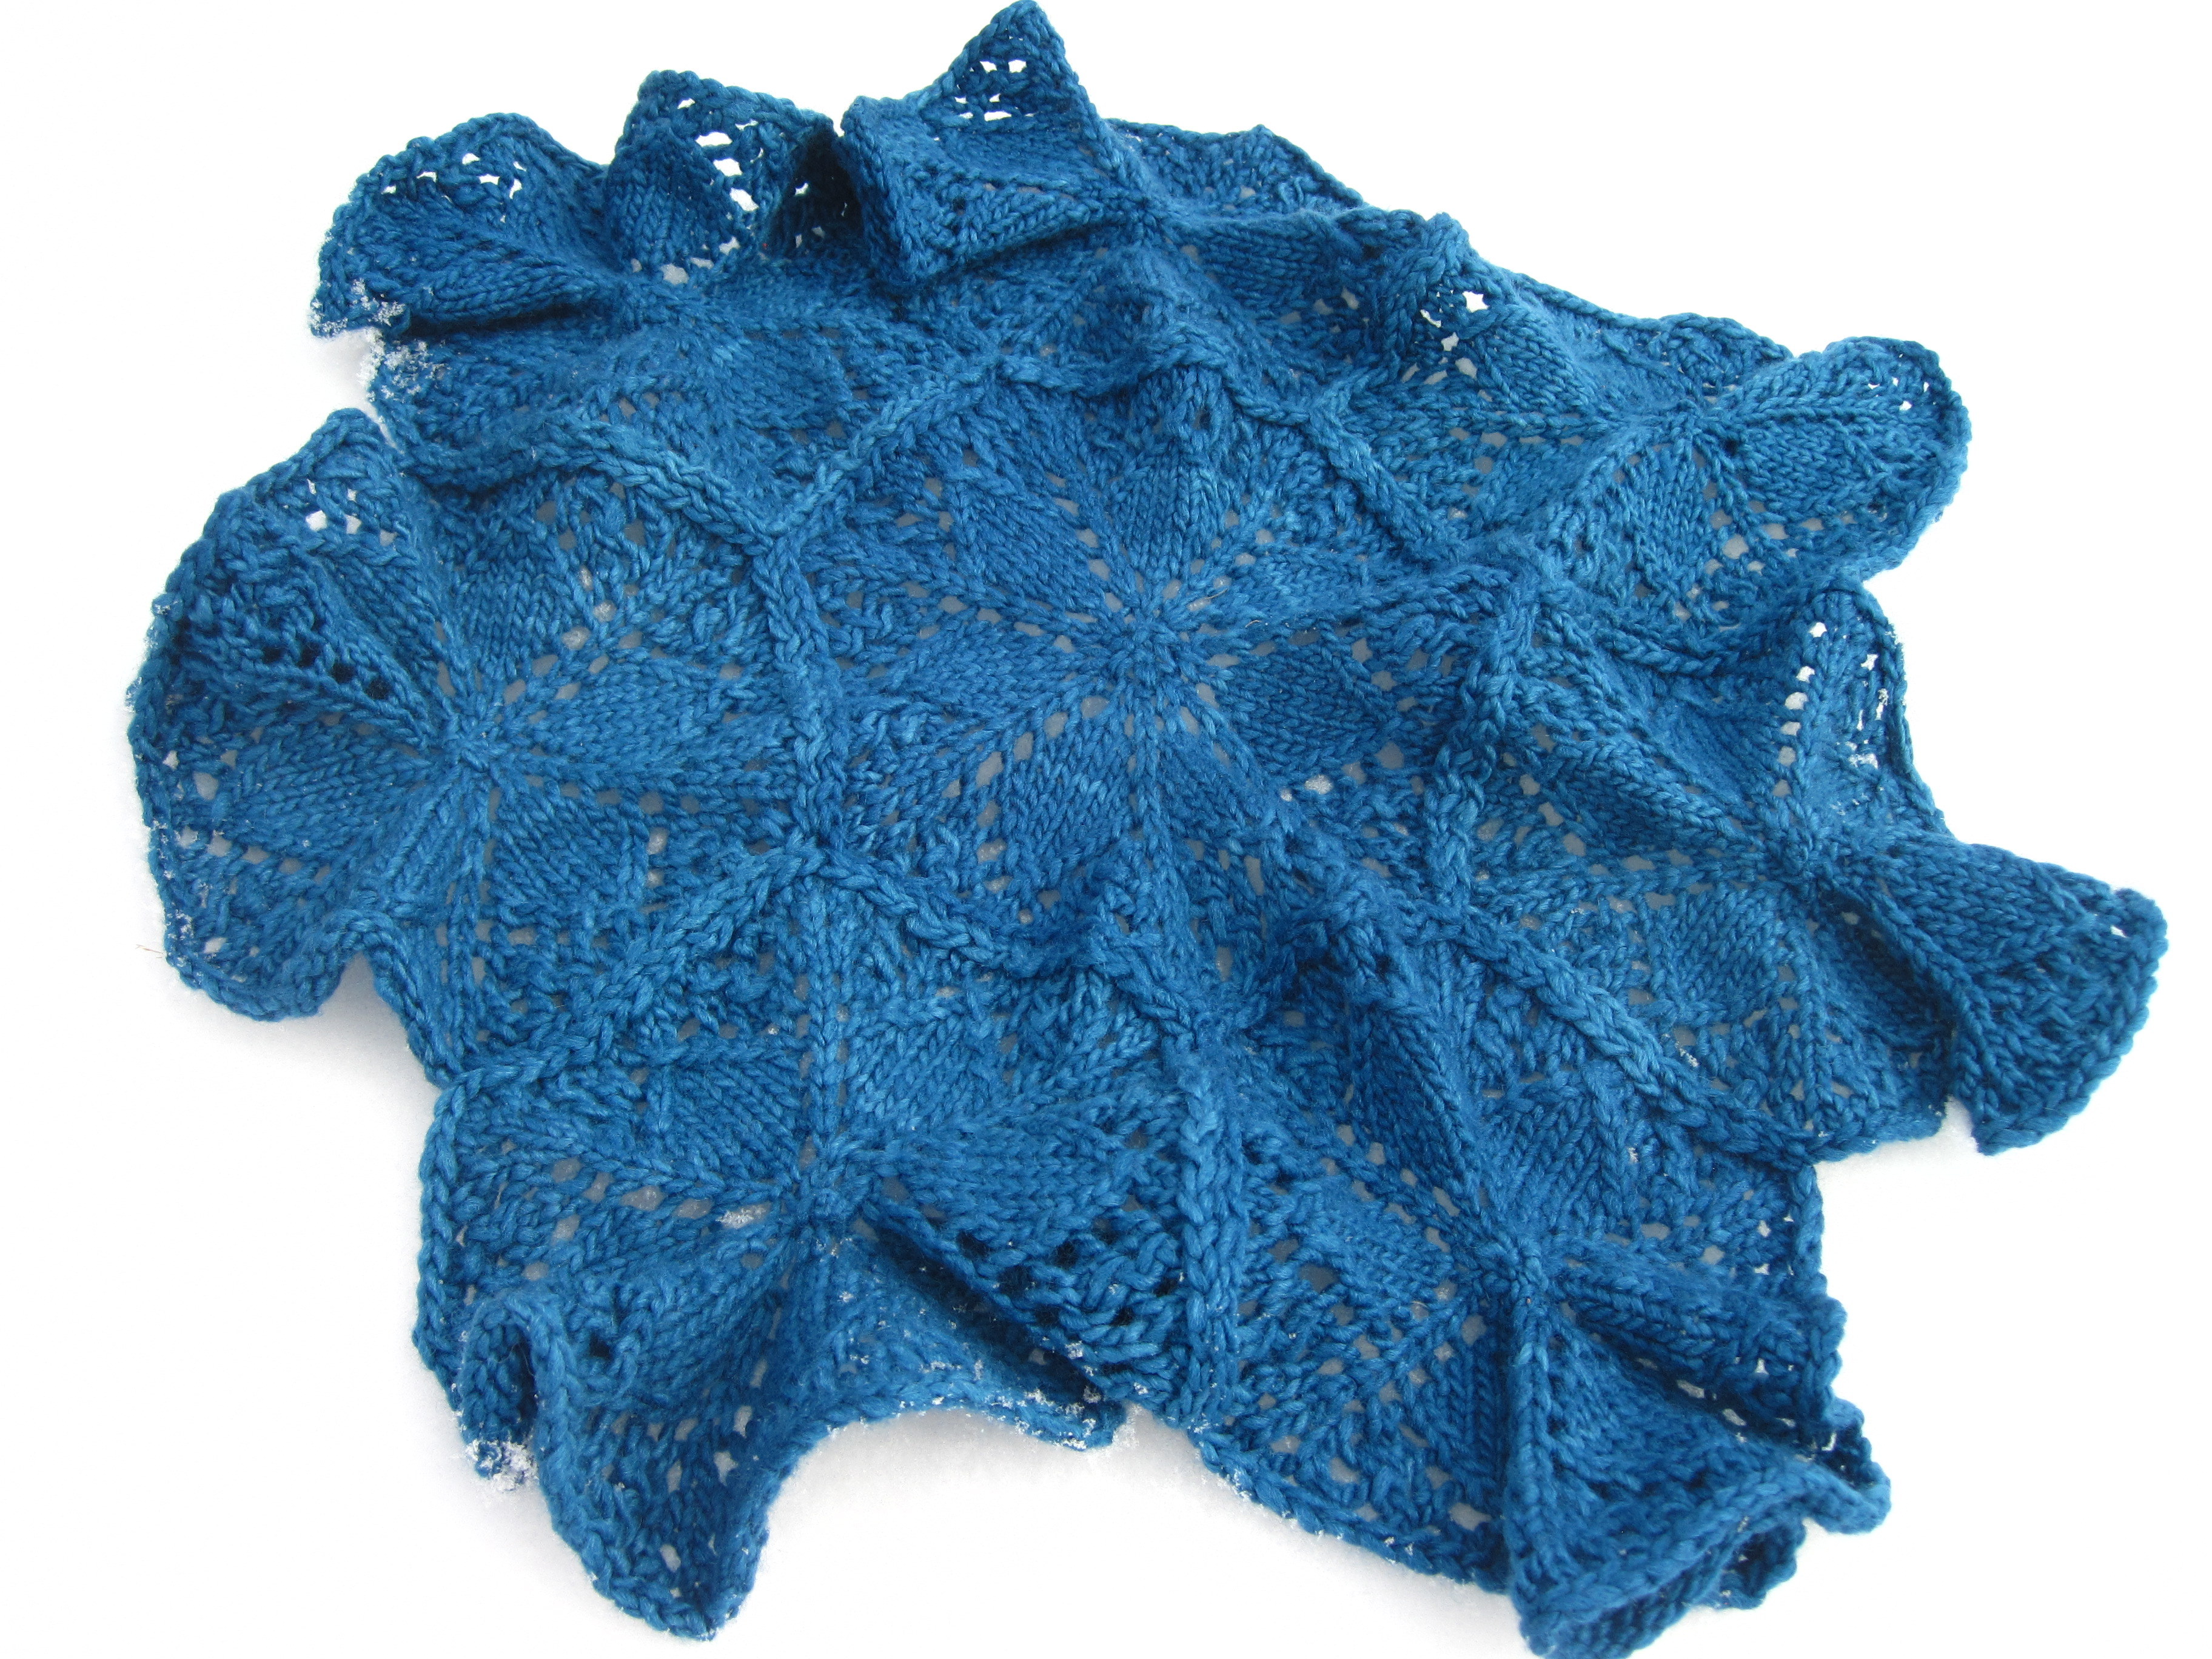 |
|
Teal Guidici University of Michigan, Isoforms of p53 2017 marks the 40th anniversary of the discovery of alternative splicing. Wild type p53 is presented here (in the center of the image), along with four of its splice isoforms (from left to right: ∆40p53β, ∆133p53, wt p53, ∆133p53γ, ∆40p53), in the style of stained glass window from the Prairie School of architecture. The center vertical band shows the complete protein, with the first transactivation domain in blue, the second in yellow, followed by the proline rich domain in orange. The three red bands represent the DNA binding domain, followed by the nuclear localization signal domain in blue and the oligomerization domain in purple. Living in the American Midwest, I have had the opportunity to appreciate the inspiration behind the Prairie School of architecture, as well as its influence on art and design. I chose this style for the piece as the simplicity and clean lines of the movement seemed a natural fit to illustrate alternative splicing. The choice of p53 was personally motivated, as I am intimately acquainted with cancer in my academic and personal life. The protein is a fascinating and critical puzzle for cancer researchers, one into which bioinformaticians may be able to provide crucial insight. | 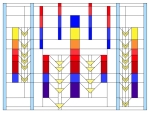 |
|
Nick Schurch University of Dundee, Chris Cole, University of Dundee, ImpactFactor impactFactor is a perspective on the use of the Journal Impact Factor scores in science. In taking a literal interpretation of this score we, as scientists, are questioning its use as a measure of scientific quality or importance. Journal Impact Factor aims to reflect the importance of a journal, however it is now used to assess the quality of the scientists who publish within it. Employers and funding bodies conflate this artificial metric as a simplistic judge of a scientist’s quality with their choice of publisher. With this perspective for modern scientists, it could be argued that where they publish has become more important than the science itself! We feel it would be much better to judge both the scientist and their publications on merit alone. The use of artificial quality metrics is an issue for all scientists and this piece is part of the discussion of moving scientific publishing away from its 17th Century roots. Publication remains a cornerstone of scientific research but impactFactor highlights the need for a better way to judge, and, perhaps publish, impactful science. The original acrylic on canvas artwork was exhibited at Symbiosis, a local collaborative Science/Art exhibition in Dundee. The piece measures 2m x 2m and is too big to bring to the conference, instead, we present here a 70cm x70cm photographic interpretation of the piece. | 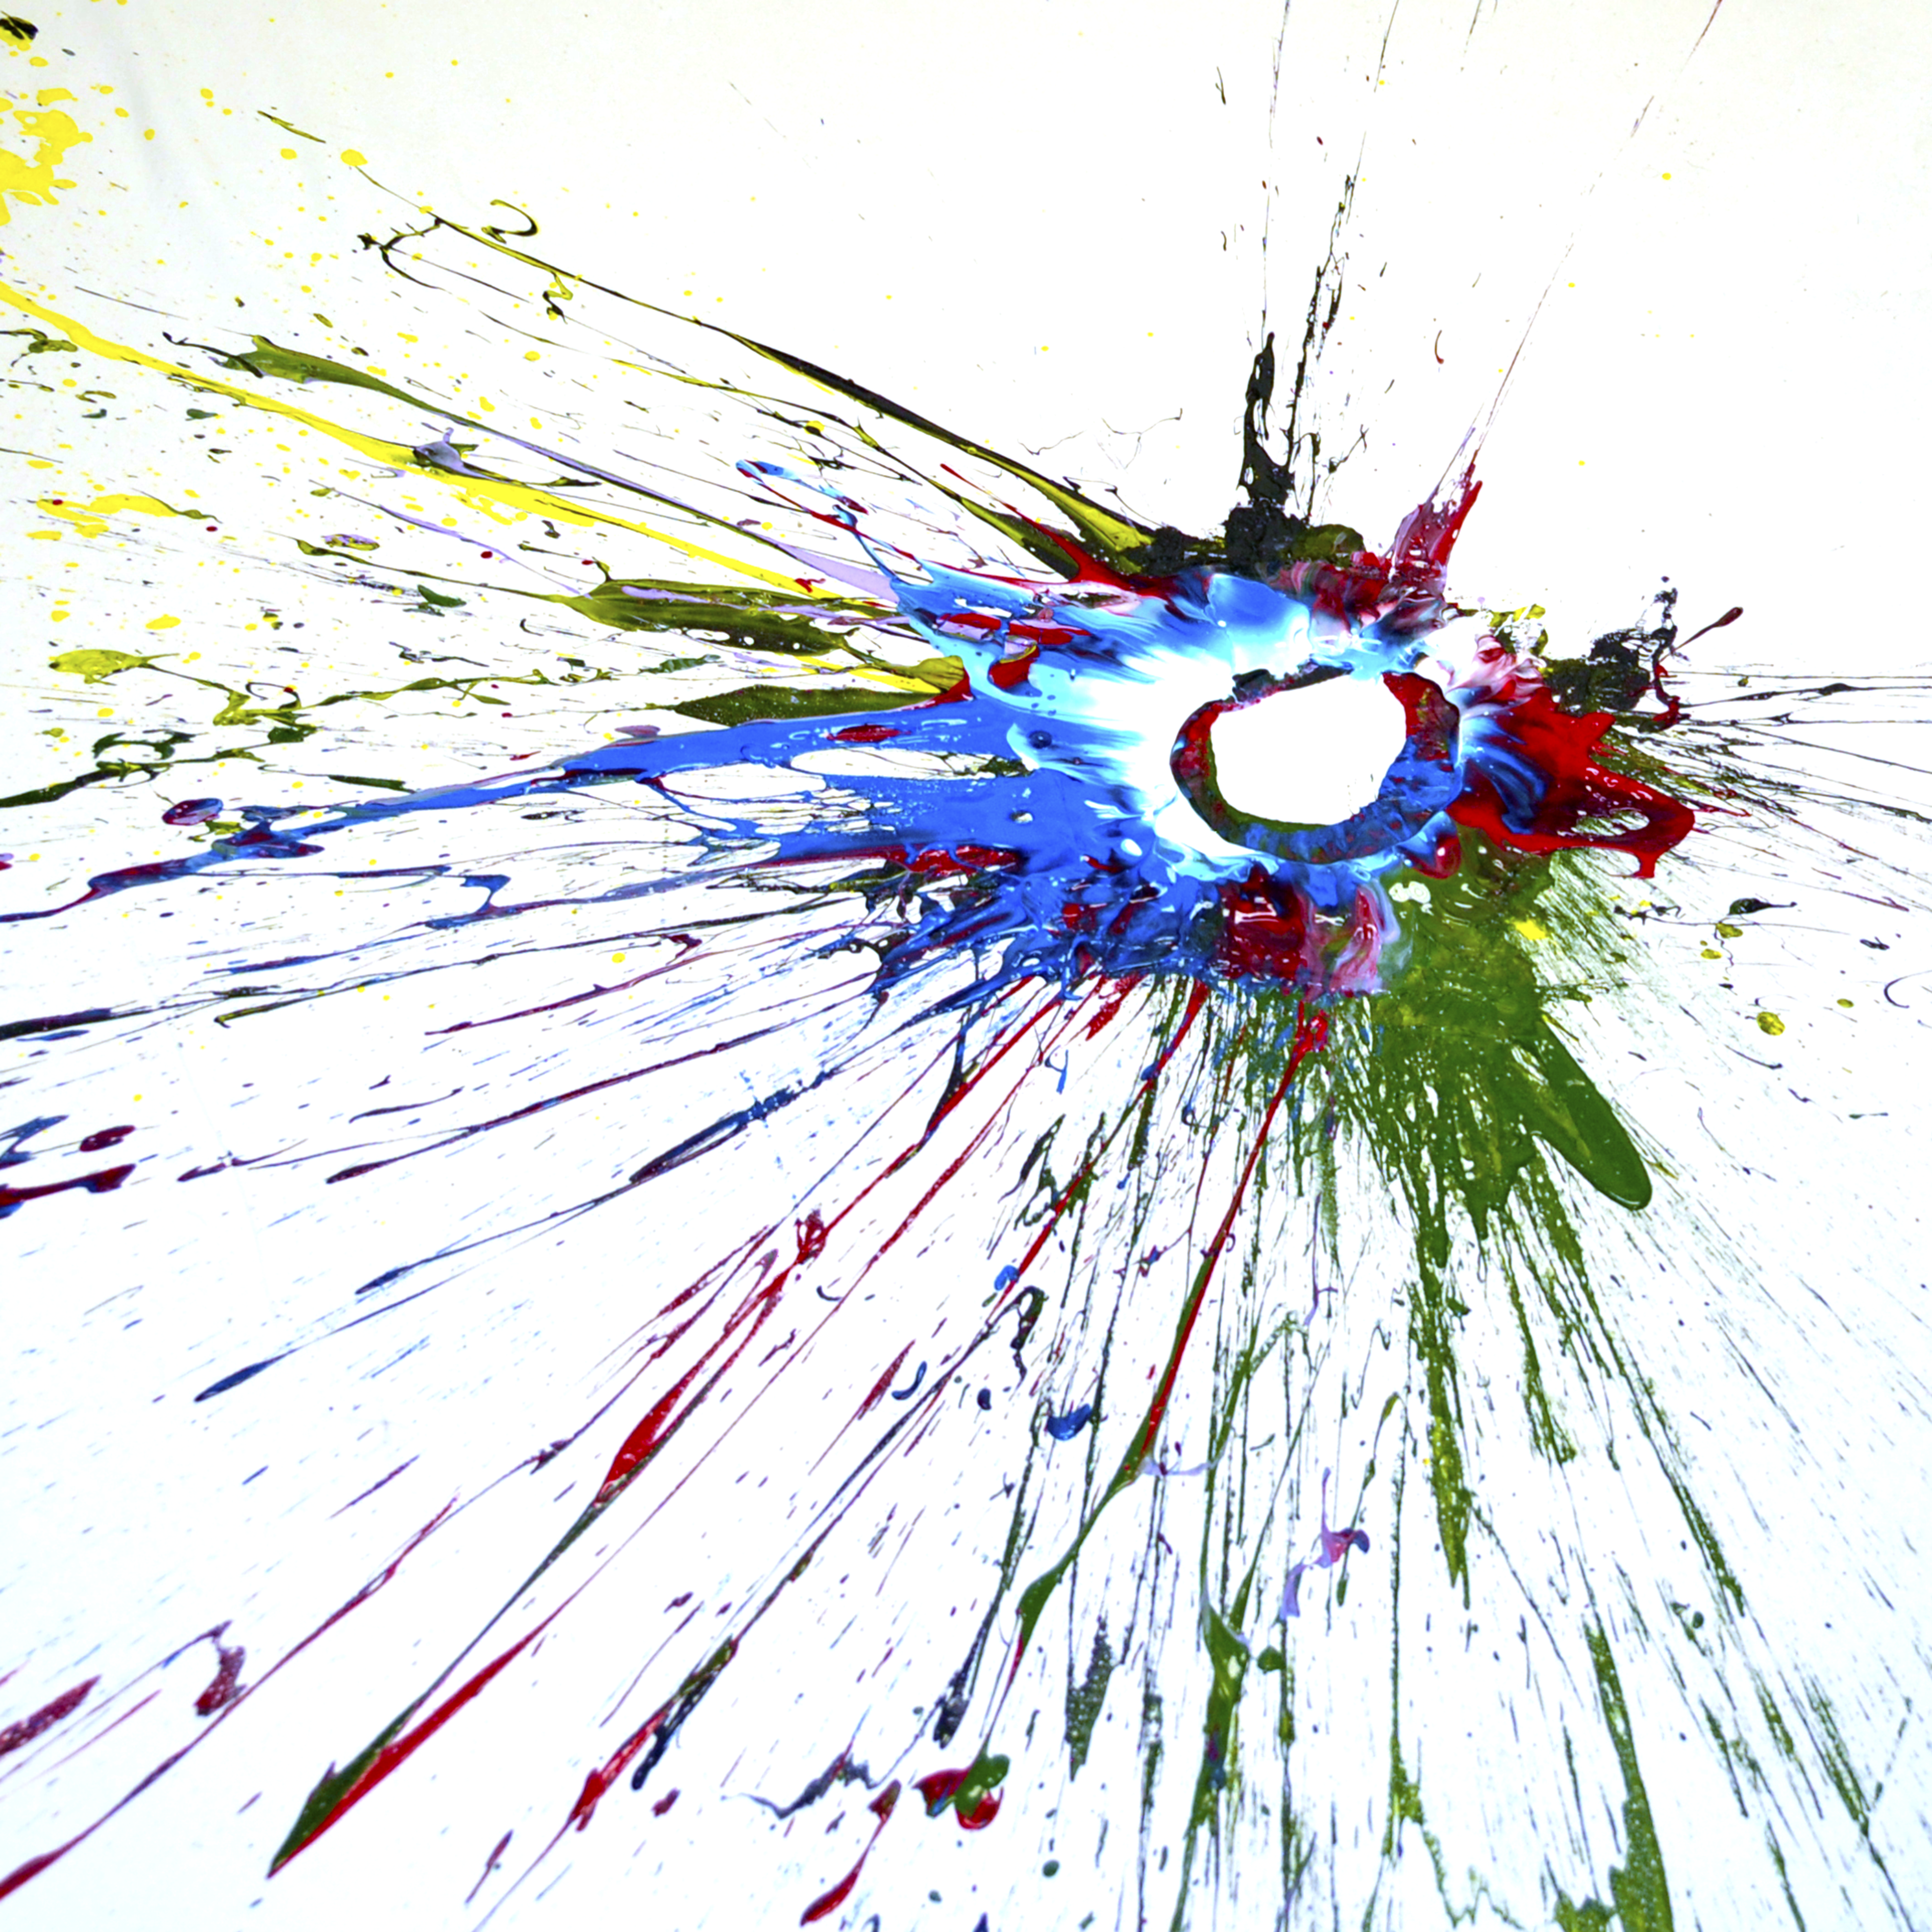 |
|
Hironori Iwai Institute for Advanced Biosciences,Keio University, Daiki Horikawa, Institute for Advanced Biosciences,Keio University, Japan Kazuharu Arakawa, Institute for Advanced Biosciences,Keio University, Japan Masaru Tomita, Institute for Advanced Biosciences,Keio University, Japan Takashi Komatsu, The Kyushu University Museum, Japan Munetoshi Maruyama, The Kyushu University Museu, Japan A Microdon katsurai larva was discovered in the Polyrhachis lamellidens nest. Abstract The hoverfly Microdon (Chymophila) katsurai Maruyama et Hironaga 2004 was speculated to be a myrmecophilous species associated with the ant Polyrhachis lamellidens based on observations of adults near the ant nest. However, there have been no reports regarding the observation of immature stages of this species in association with P. lamellidens. For the first time, we found three M. katsurai larvae inside a P. lamellidens nest and conducted rearing experiments on the larval M. katsurai. P. lamellidens workers did not show any inspection or attack behavior against the M. katsurai larvae under rearing conditions, suggesting that M. katsurai larvae can survive inside a P. lamellidens nest. Although no predatory behavior by the M. katsurai larvae was observed, all the M. katsurai larvae pupated and emerged in a rearing environment. The dorsal surface of the larval M. katsurai has a distinct pale green color with a uniform reticular structure. The puparium of M. katsurai shows several morphological features that are characteristic of the subgenus Chymophila. We conclude that M. katsurai is likely a myrmecophilous species that utilizes P. lamellidens as a specific host and that classification of M. katsurai based on puparium morphology is concordant with that based on adult morphology. Reference Iwai,H, et al.(2016) Rearing and observation of immature stages of the hoverfly Microdon katsurai (Diptera, Syrphidae). Biodivers Data J. 2016 Dec 9;(4):e10185. | 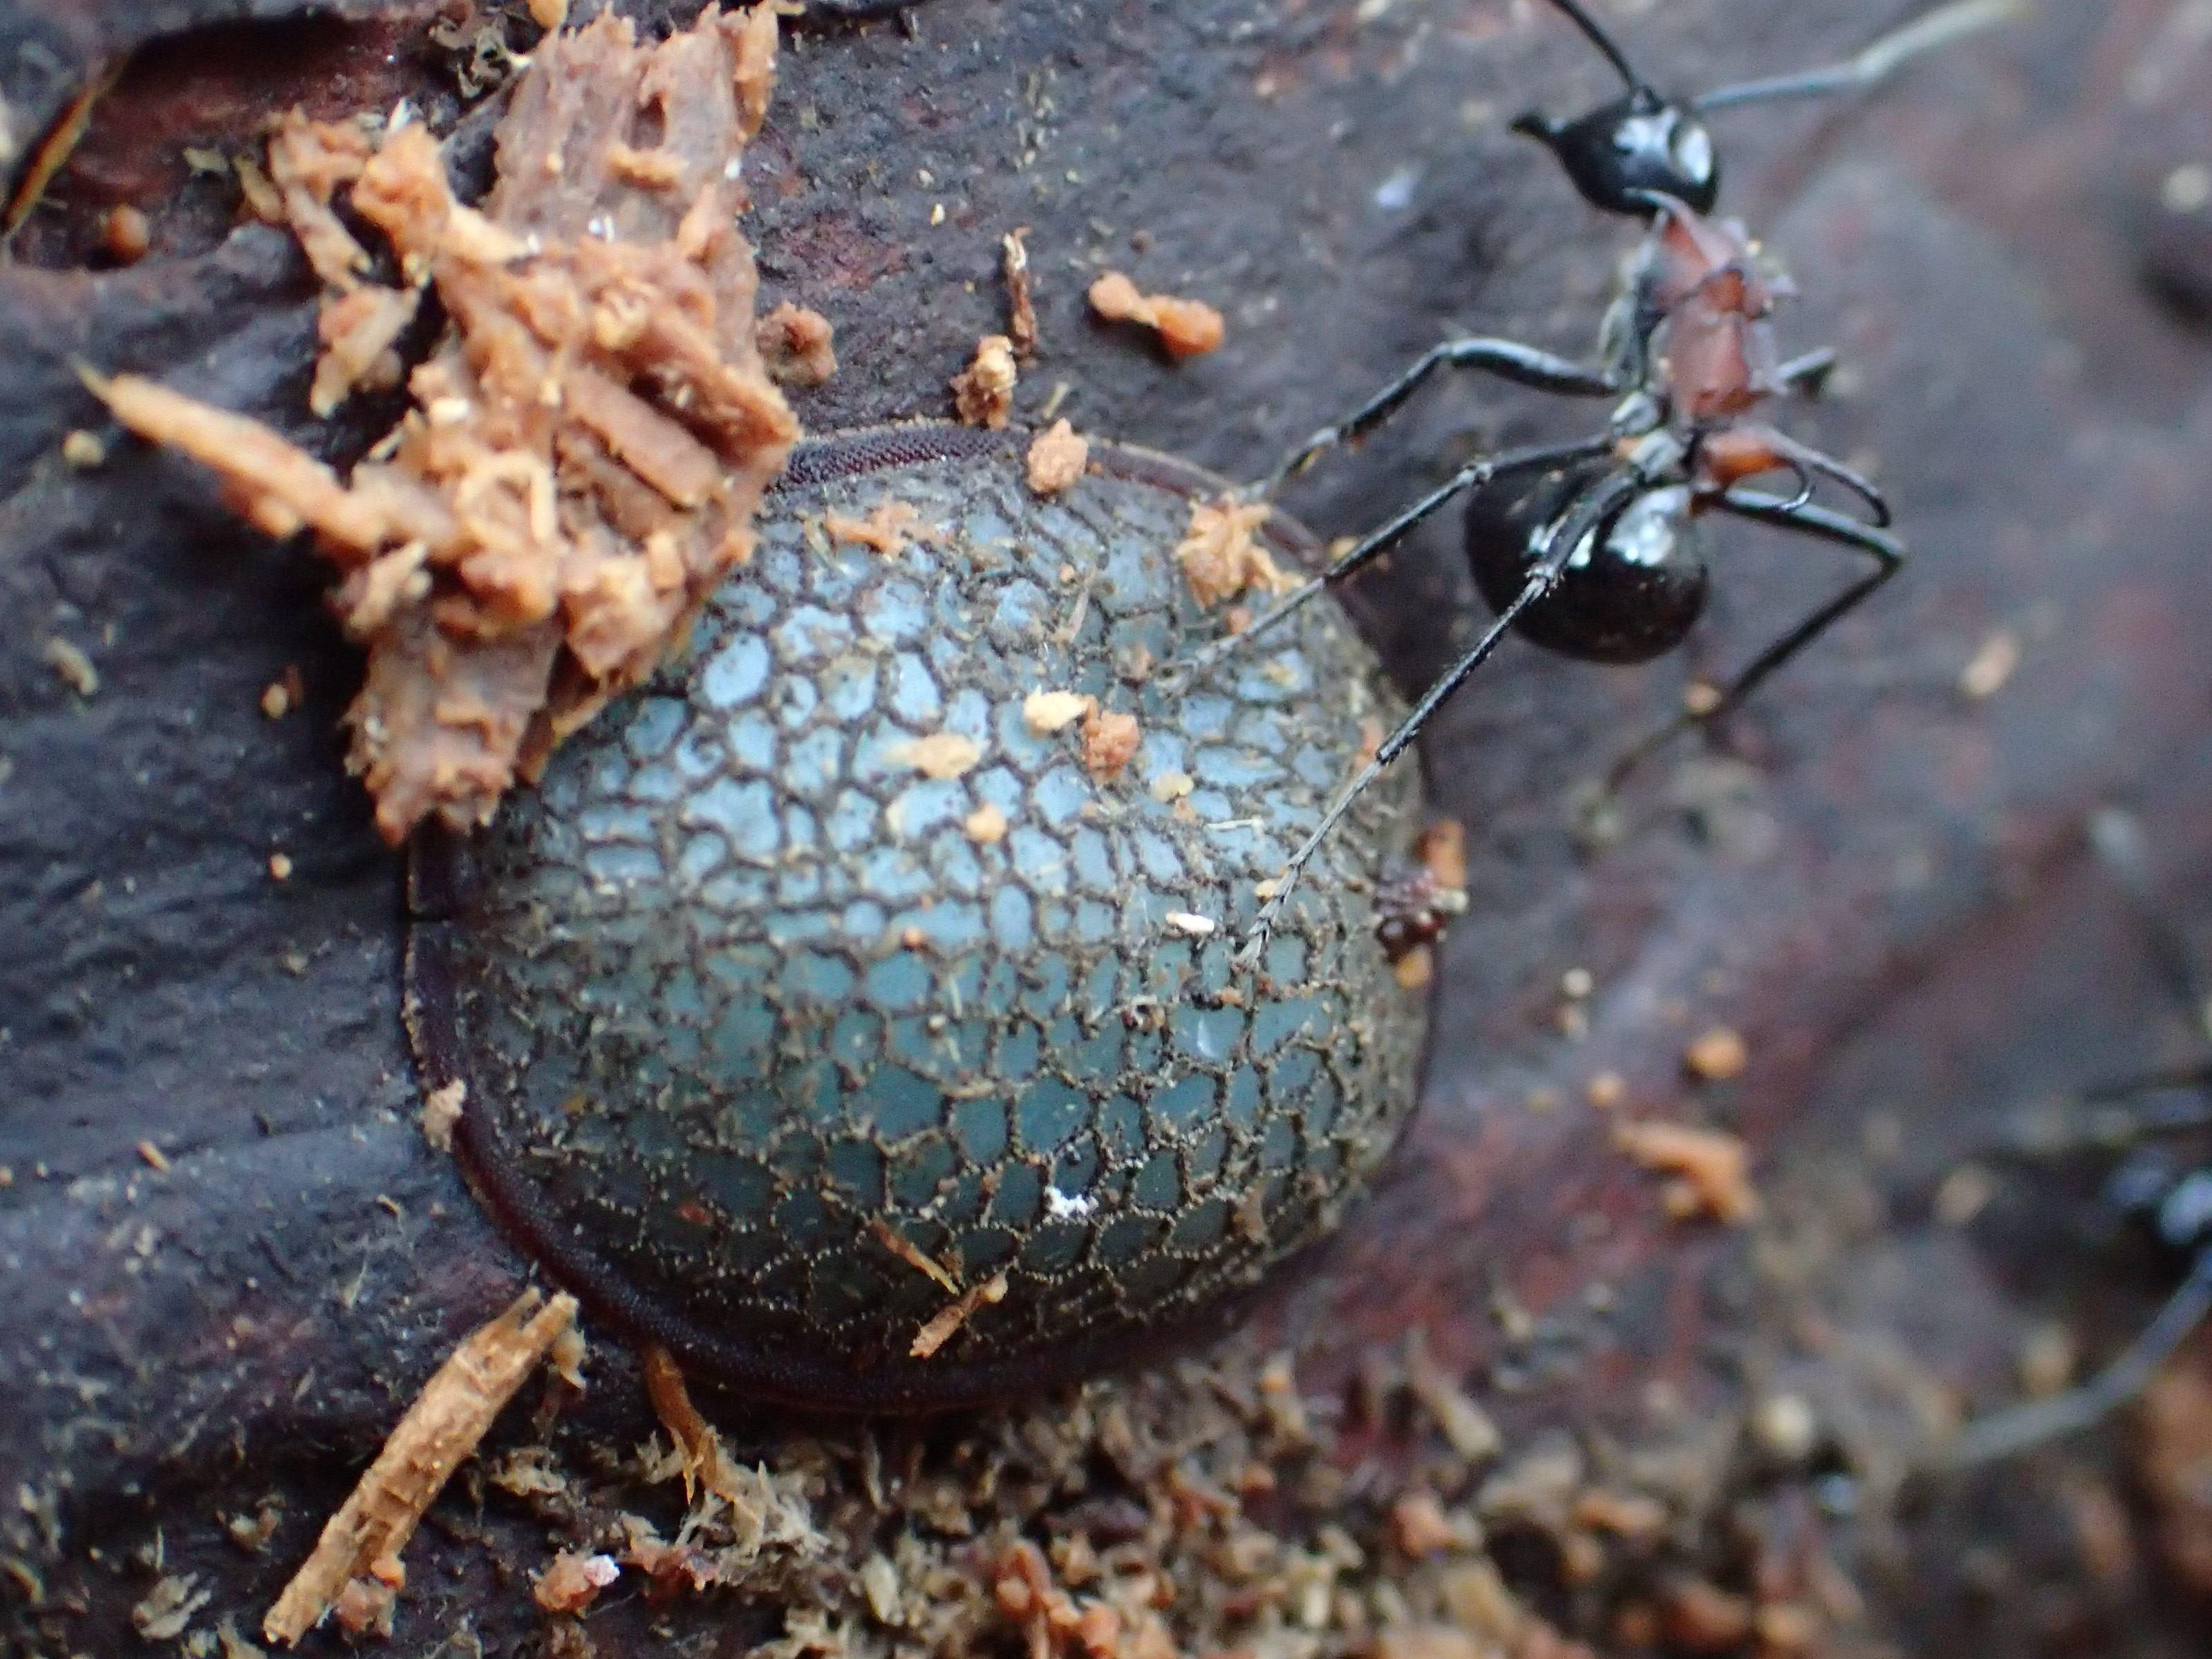 |
|
Tarun Jairaj Narwani French National Institute of Health and Medical Research, Alexandre de Brevern, French National Institute of Health and Medical Research, France Vincent Jallu, National Institute of Blood Transfusion, France Inhibitions -- To -- Heal Human glycoprotein, Integrin αIIbβ3 mediates platelet aggregation and thrombus formation. It is expressed as inactive, bent structure on the platelet cells. Upon activation in response to a shear, the heterodimeric structure opens up, extends and binds to vWF (Von Willebrand factor). This ligand acts as a bridge between adjacent platelet cells eventually leading to clotting which is a major event in healing. The image depicts the structure of αIIbβ3 ectodomain. The structure is shown to open up at the knee domain while legs of both chains remains rigid. In next steps, the β-leg extends to expose the cavity between β-propeller and β-I head domains for binding of vWF. Platelet aggregation usually happens with Fibrinogen as the bridge. However, vWF is the ligand in cases of high shear conditions. The background color hints at the healing of a wound. A crouching human signifies the resemblance of Human anatomy with the structure of αIIbβ3. When the Integrin fails to open up; Aggregation is inhibited and leads to fatal excessive bleeding. The scene is a comment on the barriers between human interactions. I imagine it as a biological inspiration for Humans to break shackles, open up, extend and aggregate to clot the bleeding and heal the wounds. | 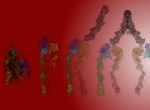 |
|
Aviad sivan Bar ilan university, invasion A virus is creeping through the cell membrane skimming to unleash his genetic cargo into the cytoplasm, as a part of his will to conquer and harness the power of the cell, planing to enslave an army of Ribosomes. The cell immediately reacts by mass producing anti-viral proteins, initiating self defensive cascades. Ribosomes promptly process mRNA molecules turning them into peptides that will join forces turning into protein-war-machines in an attempt to block the invasion. Despite those desperate attempts inevitably more and more ribosomes are turning sides, drawn like magnates to the viral nucleic acid that has been mutated thousand of times creating such a precise codon-usage which was selectively chosen for each amino acid resulting in a molecular harmony between the cell's ribosomes and the viral mRNA. Slowly turning the cell into a slave manufacturing virions until surrendering and unleashing the assembled virions looking where to invade next. |  |
|
Irina Glotova SBGD Inc., Computational Bridges to Experiments The artwork was created for the front page of the paper published on the COMBREX (COMputational BRidges to EXperiments, http://combrex.bu.edu) project: http://journals.plos.org/plosbiology/article?id=10.1371/journal.pbio.1001638. This multifaceted project aims to bring together the computational and experimental communities of biologists in the interest of improving our understanding of microbial gene function and accelerating the annotation of microbial gene function. Therefore, I designed an artwork that shows the COMBREX system, which is based on active learning principles, creating these "computational bridges" between predictions and actual experimental scientists who can validate them. | 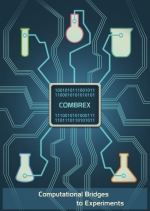 |
|
Aleksandra Dawid University of Warsaw, Coarse-grained protein models Coarse-grained modeling offers unique and compelling opportunities for modeling and simulation of proteins. Coarse-grained models have been successfully used in many practical applications, including computational prediction of protein structure, protein interactions, protein dynamics and structure-based drug design. Using several models of varying levels of detail in one simulation path is called multi-scale modeling, which allows you to cross barriers related to system size and simulation time. The graphics show models of protein structure with differentiated simplification of the representation: from the full-atomic structure (bottom left corner) to coarse-grained models such as CABS (right bottom corner). In other cases the protein can be represented as its surface or ribbon diagram or a system of few united atoms. Boxes around each particle can be understood as crystallographic cells, but due to the theoretical nature of models can also be a simulation boxes. Image was used as cover art of Chemical Reviews, Volume 116, Issue 14, July 27, 2016 (http://pubs.acs.org/toc/chreay/116/14) and is related to the article “Coarse-Grained Protein Models and Their Applications”. Author: Aleksandra Elżbieta Dawid Copyrights holder: Copyright©2017 American Chemical Society Journal: Chemical Reviews "No permission is necessary to use the covers and they may be used for any purpose." Reference: Kmiecik S., Gront D., Kolinski M., Wieteska L., Dawid A.E., and Kolinski A. Coarse-Grained Protein Models and Their Applications. Chemical Reviews, 2016, 116 (14), pp 7898–7936. | 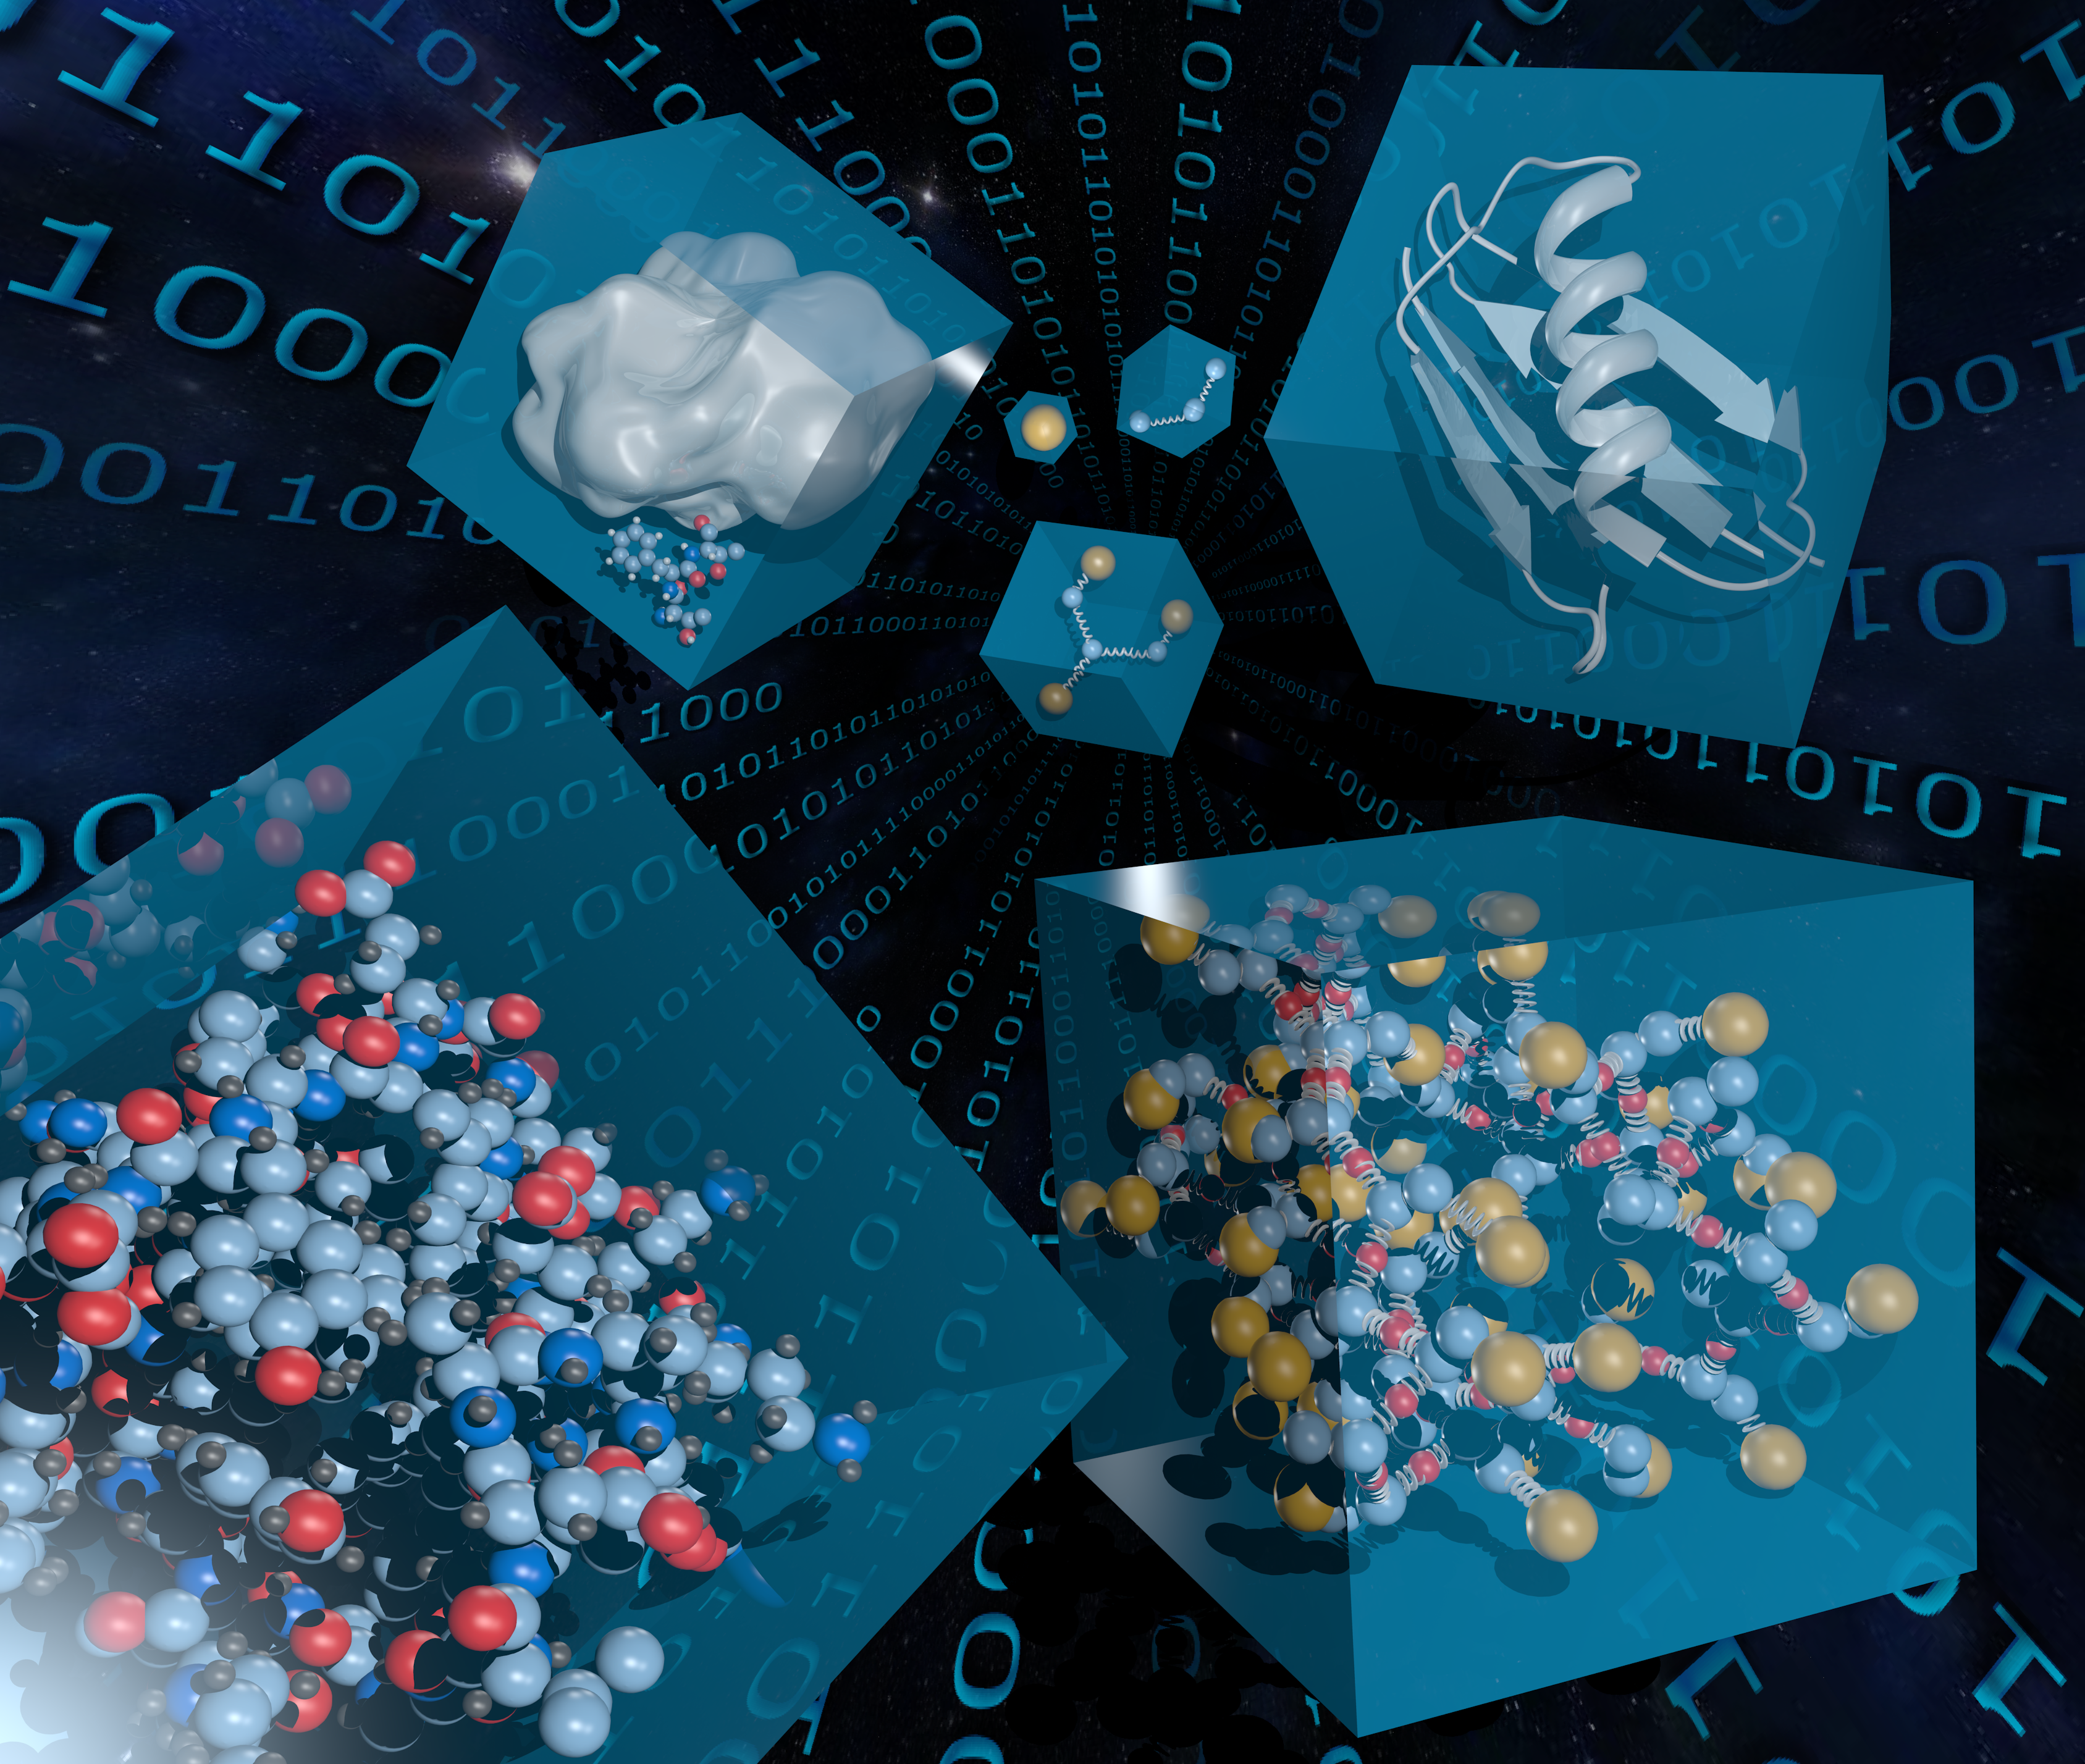 |
|
Michael Caldera CeMM - Research Center for Molecular Medicine of the Austrian Academy of Sciences, The Crystal Structure Network The artworks represents the crystal structure network. Whereas each node represents a molecule and each edge between two nodes, the possibility of the two to form a stable crystal. The two big communities at the left and right represent the two big classes of crystals, namely charged ( e.g. NaCl) and uncharged (e.g. crystal of two amino acids). The network was created using data from the CSD (Cambridge Structural Database), a highly curated and comprehensive resource compromising more than 800.000 crystal structures. In order to create the crystal network, the SMILE (i.e. simplified molecular-input line-entry) string of bimolecular crystals was extracted and splitted into the two individual molecules. The individual colors correspond to specific communities (i.e. molecules sharing certain preference for crystal forming) or single hubs (i.e. molecules creating many different crystals), e.g. ions like Na+. The artwork shows the variety and diversity of molecular crystals and their underlying chemistry. Although some molecules tend to form many more crystals than others, one sees immediately the millions and billions of possible combinations of molecules. Further the illustration nicely shows, how a few molecules even manage to combine two "different worlds" or charged and uncharged crystals. | 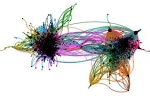 |
|
Shingo Miyauchi The Institut national de la recherche agronomique, Tatami atlas for visualization of genome-wide gene expression The tatami atlas shows genome-wide gene expression of a fungus (Pycnoporus coccineus) grown under multiple conditions. It is easy to inspect and visually compare time-course transcriptomes with multiple conditions. It is a great way of visualizing RNA-seq data with the relaxed ambience of Zen when audiences show little or no interest in your work. The tatami atlas can be appreciated by people of all ages and it is sure to impress your mother in law. Each heatmap represents the transcription level of 1,1430 genes of a single replicate. Three biological replicates were grown with four different substrates (maltose, aspen, pine, wheat straw) for three and seven days. Colours in the cells of heatmaps represent the mean log2 transformed read count of similarly regulated genes. Transcription levels of the genes in response to the substrates were sorted based on their similarities by the self-organizing map algorithm. The methods for the production of the tatami atlas are described in details (Miyauchi et al 2016; 2017). Reference: 1. Miyauchi, S. et al. Visual Comparative Omics of Fungi for Plant Biomass Deconstruction. Front. Microbiol. 7, 1335 (2016). 2. Miyauchi, S. et al. The integrative omics of white-rot fungus Pycnoporus coccineus reveals co-regulated CAZymes for orchestrated lignocellulose breakdown. PLoS One 1, 1–17 (2017). | 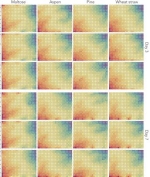 |
|
Vikrant Palande Bar-Ilan University, Israel, "molecular diagnosis for personalized medicines" Personalized medicine has been making its remarkable impact in the field of science. These technique are opening the new era of diagnosis as well as prognosis field. Advancement in the sequencing as well as PCR techniques have eased the processing DNA for finding specific the alterations in it. This indicates that very soon classical way of diagnosis of any kind of diseases will be replaced by molecular diagnostic techniques. Liquid biopsy is rapidly developing non-invasive diagnostic technique which has already made its firm standing in diagnosis of some cancer types as well as prenatal diagnosis. Using this technique number of startup companies are emerging and brightening the hope of developing easy and more useful non-invasive techniques. This picture that is submitted to this competition is showing the future of medicine prescription given by a physician to its patient. Personalized medicines are the need of this century which will indeed help in improving quality of medicinal treatment given to any patient. |  |
|
Aleksandra Dawid University of Warasaw, Loop quantum gravity Author: Aleksandra Elżbieta Dawid Copyrights holder: Aleksandra Elżbieta Dawid Loop quantum gravity (LQG) is a quantum theory of spacetime, which attempts to reconcile seemingly incompatible quantum mechanics and general relativity theory. It is a theory of discrete, quantized units of spacetime because, according to general relativity, gravity is a manifestation of the geometry of spacetime. Picture shows a graphical representation of gravitational phenomena. At the bottom we see the classic analogy of curvature of multi-dimensional spacetime caused by a mass object, in this case the globe. Matter changes the geometry of spacetime and the curvature is interpreted as waves of gravity. To get at least some of the information about quantum gravity, researchers construct simplified quantum models such as those shown at the top of the image. Thanks to the general theory of relativity we know that gravity is the same as geometry. The starting point in the model are two fields: gravitation (space, on the fig.: transparent objects) and scalar (number assigned to a point in space; on the fig.: red balls). Time emerges as a relation between the gravitational field and the scalar field (on the fig.: white sticks). Graphics was one of the poster proposals promoting this year's "LOOPS" conference. | 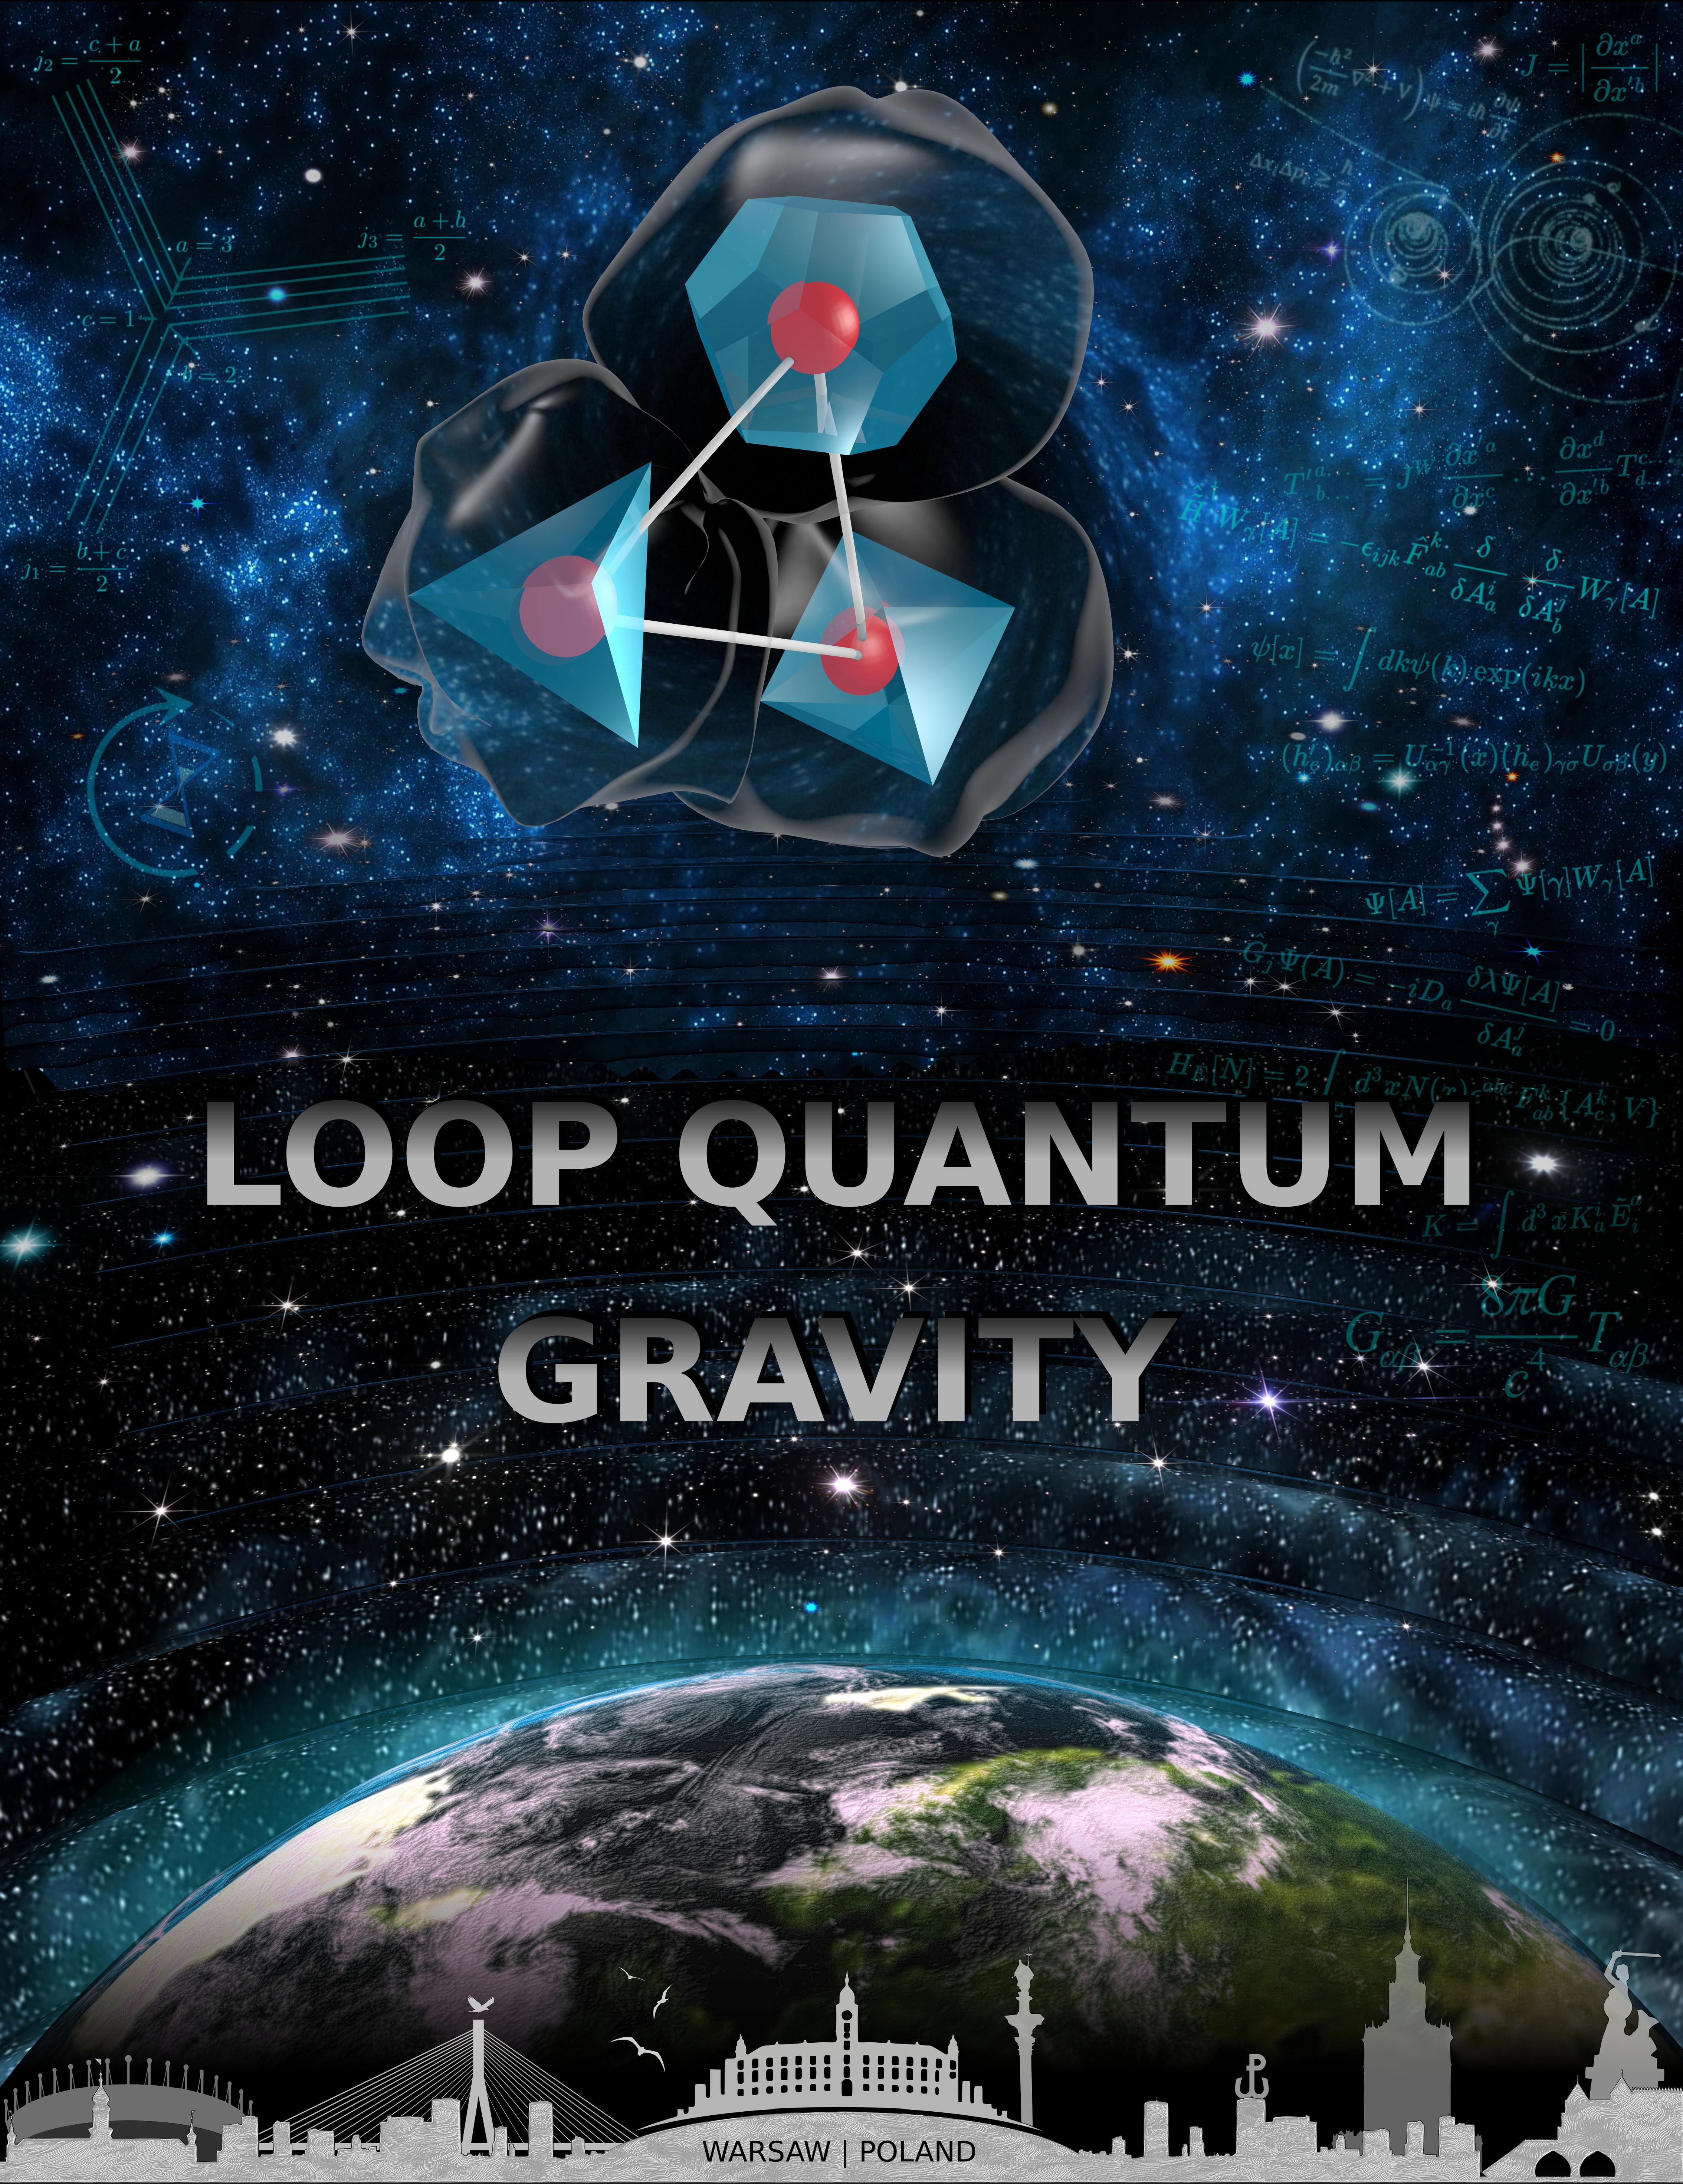 |
|
Sarah Galleguillos Austrian Centre of Industrial Biotechnology, Jürgen Zanghellini, Austrian Centre of Industrial Biotechnology, Austria Growing molecular complexity: metabolic reconstruction of Taraxacum officinale Metabolic interactions are often described by genome-scale metabolic networks. These network models reconstruct organism-specific biochemical pathways and capture the information about all known metabolic reactions and the genes that encode enzymes for these reactions in a computationally structured manner. More than a simple data repository, genome-scale metabolic networks allow for the prediction of phenotypes from the genotype. These networks are often displayed as colorful hypergraphs. Rather than with a visualization software, we reconstructed the central metabolism of the common dandelion Taraxacum officinale as a real 3D object made out of beads (metabolites) and threads (reactions). The different beads, i.e., metabolites, are color-coded with respect to their organelles of origin. The macroscopic representation of the metabolic network unveils its architectural resemblance to the structure of the dandelion flower. The white fibers mirroring the reactions (edges) hold the seeds and metabolites (nodes), respectively. Both form a "hair-ball" structure that highlights the complexity and affinity of biological systems at different scales. Acknowledgements The artist acknowledges the support and help of Mark Dürkop for the photographs and Concetta Giuliani for the materials and suggestions. | 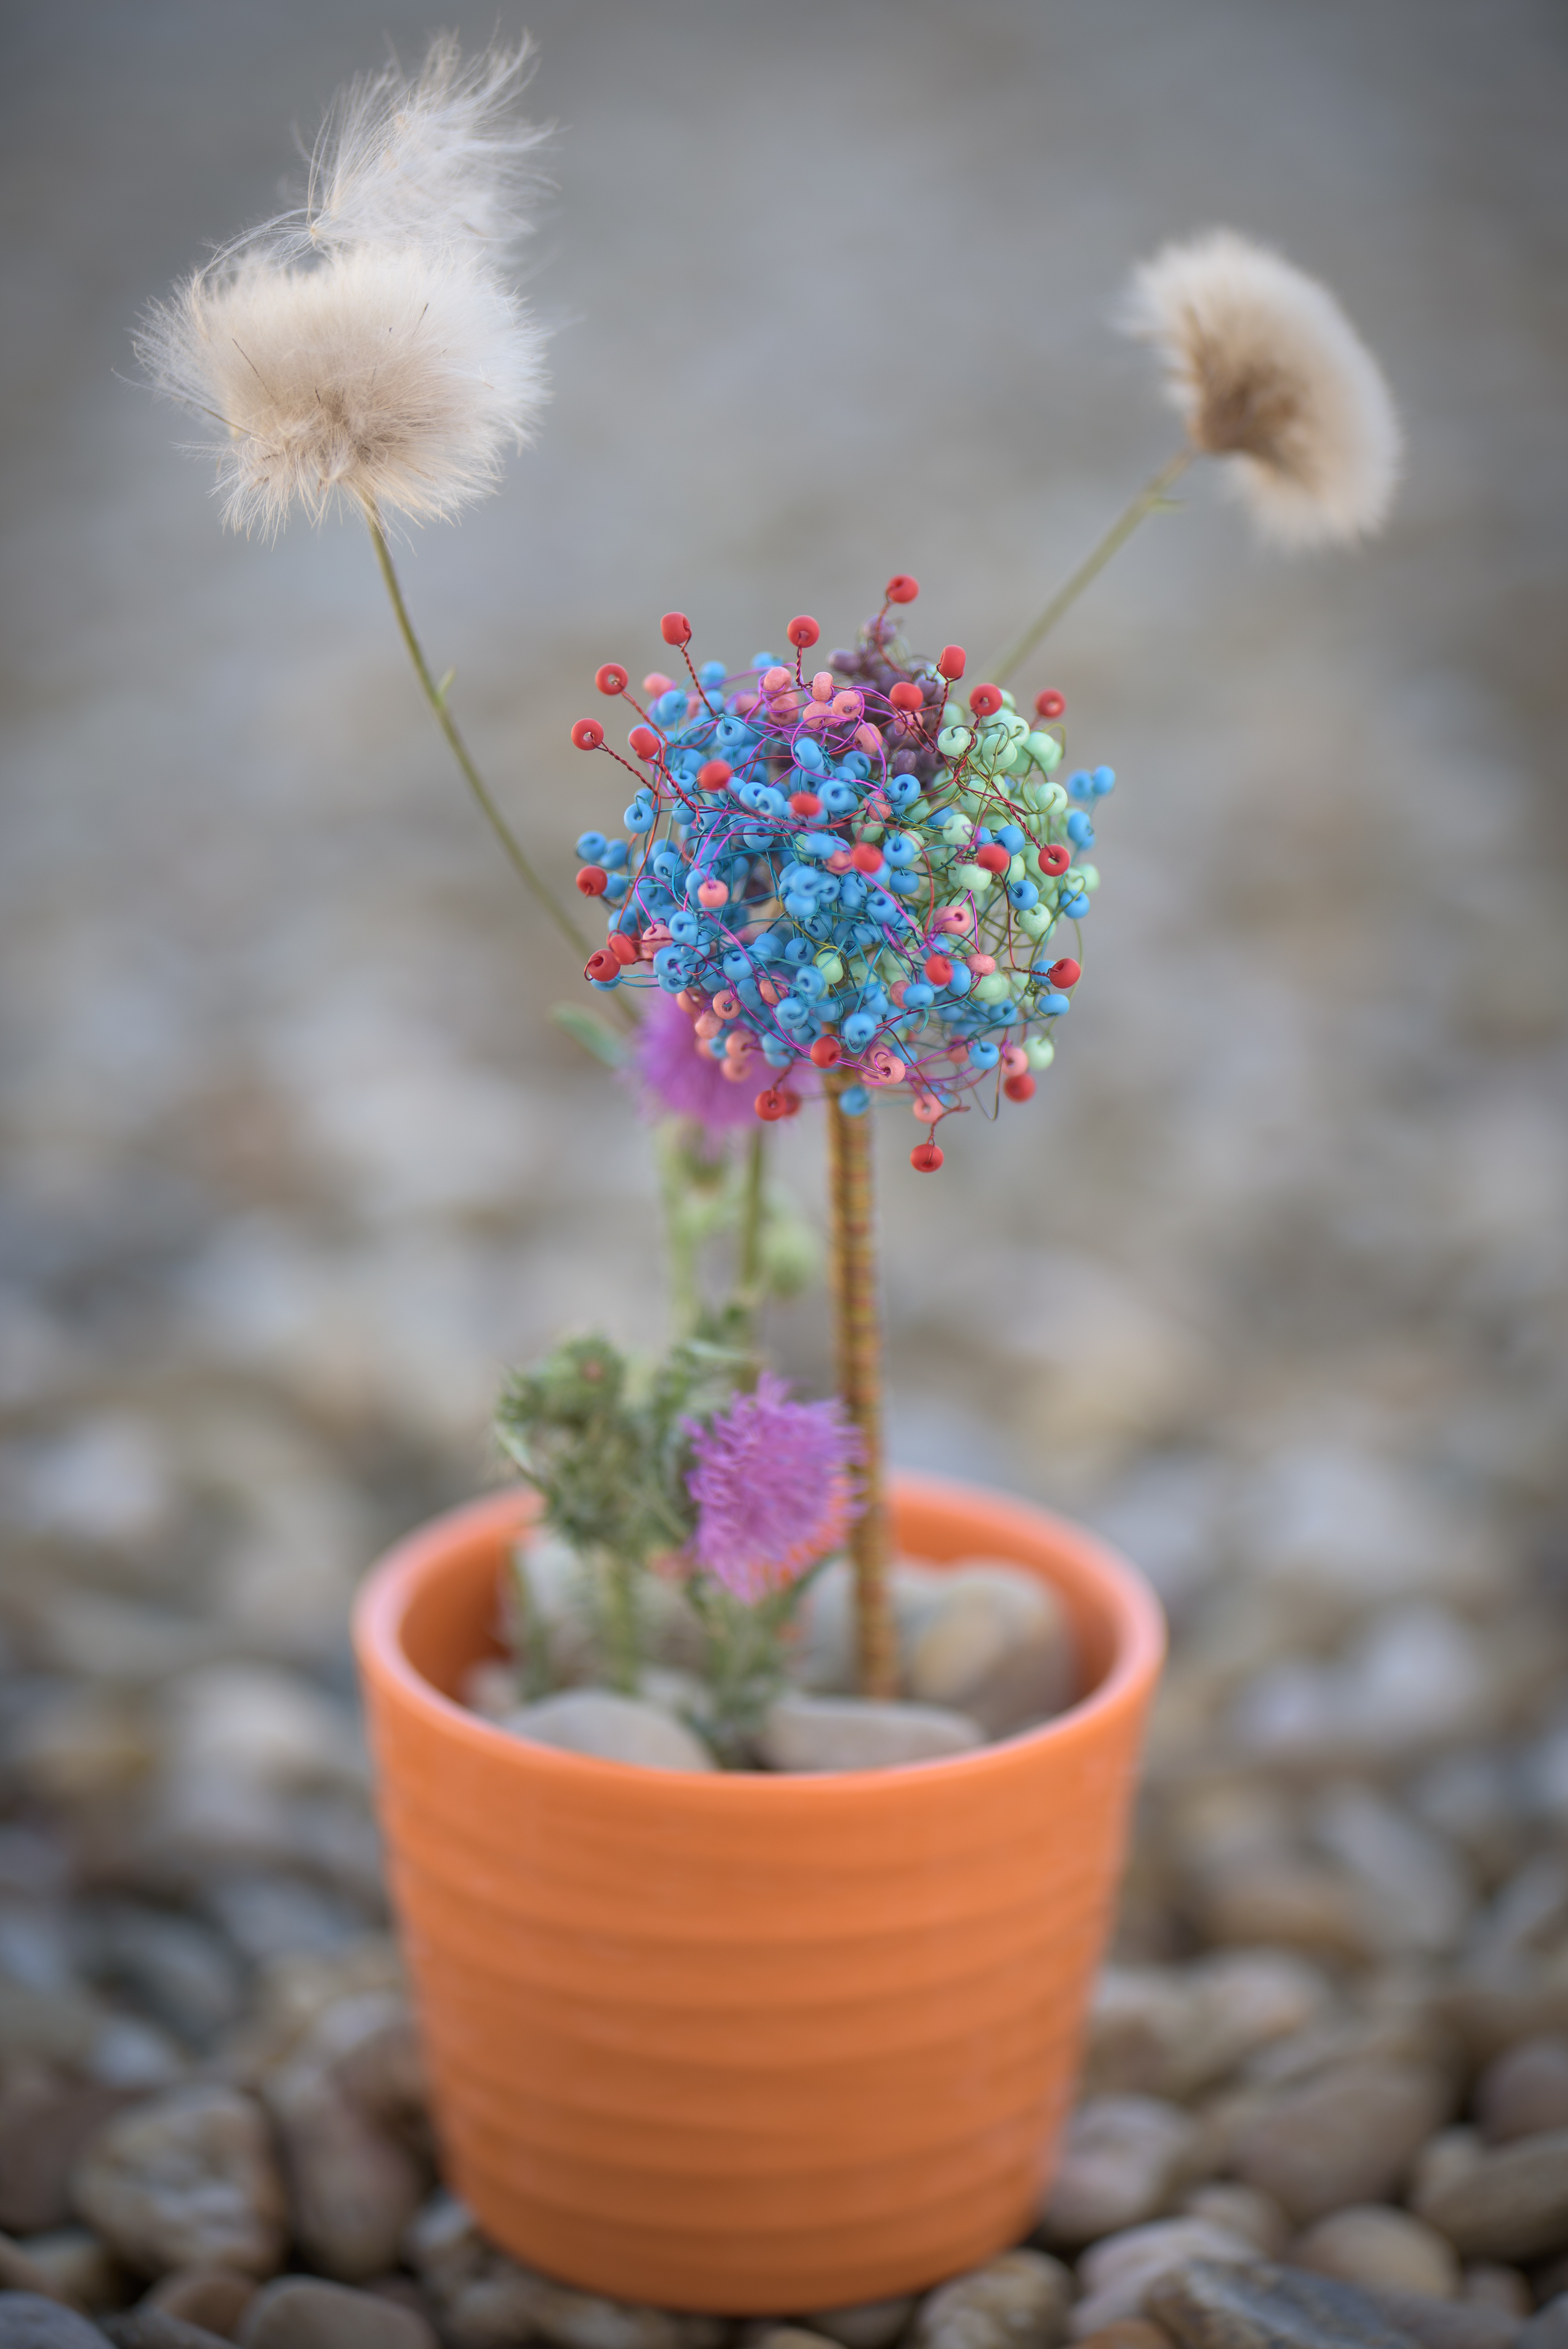 |
|
Christine Marizzi DNA Learning Center, Cold Spring Harbor Laboratory, Full STEAM ahead! The STEAM movement advocates the addition of art and design to STEM (science, technology, engineering, and math) education. The rationale is two-fold: 1) scientific discovery and technological innovation require creative thinking and 2) art and design can act as entry points for those who might otherwise be uninterested in or intimidated by technical fields. As one of Cold Spring Harbor Laboratory’s DNA Learning Center (DNALC) employees, I talk about my favorite molecule Deoxyribonucleic Acid a.k.a. DNA every single day. The discovery of DNA as well as our understanding of its structure and functioning may well be one of the most important discoveries of the last century. As part of our hands-on programs hundreds of participants used four E.coli K-12 bacteria strains genetically engineered to be fluorescent under UV-light as “paint” and Petri-plates as “canvas.” We designed a two-part workshop: In part one participants learned about bacterial culturing, sterile technique and work with live microbes as bio-regenerative paint. The plates were incubated to allow the bacteria to grow. In part two participants discussed DNA technology and observed microbes grown on agar plates in a laboratory setting. Most importantly, this Agar Art activity engaged participants to discuss critical themes such as the microbiome, big data and genetic engineering. Core concepts were explained further by watching DNALC animations online. The workshop and its resulting artworks are an excellent example of using the STEAM paradigm to engage the public in science. We are proud ASM #AgarArt Contest 2017 partners. | 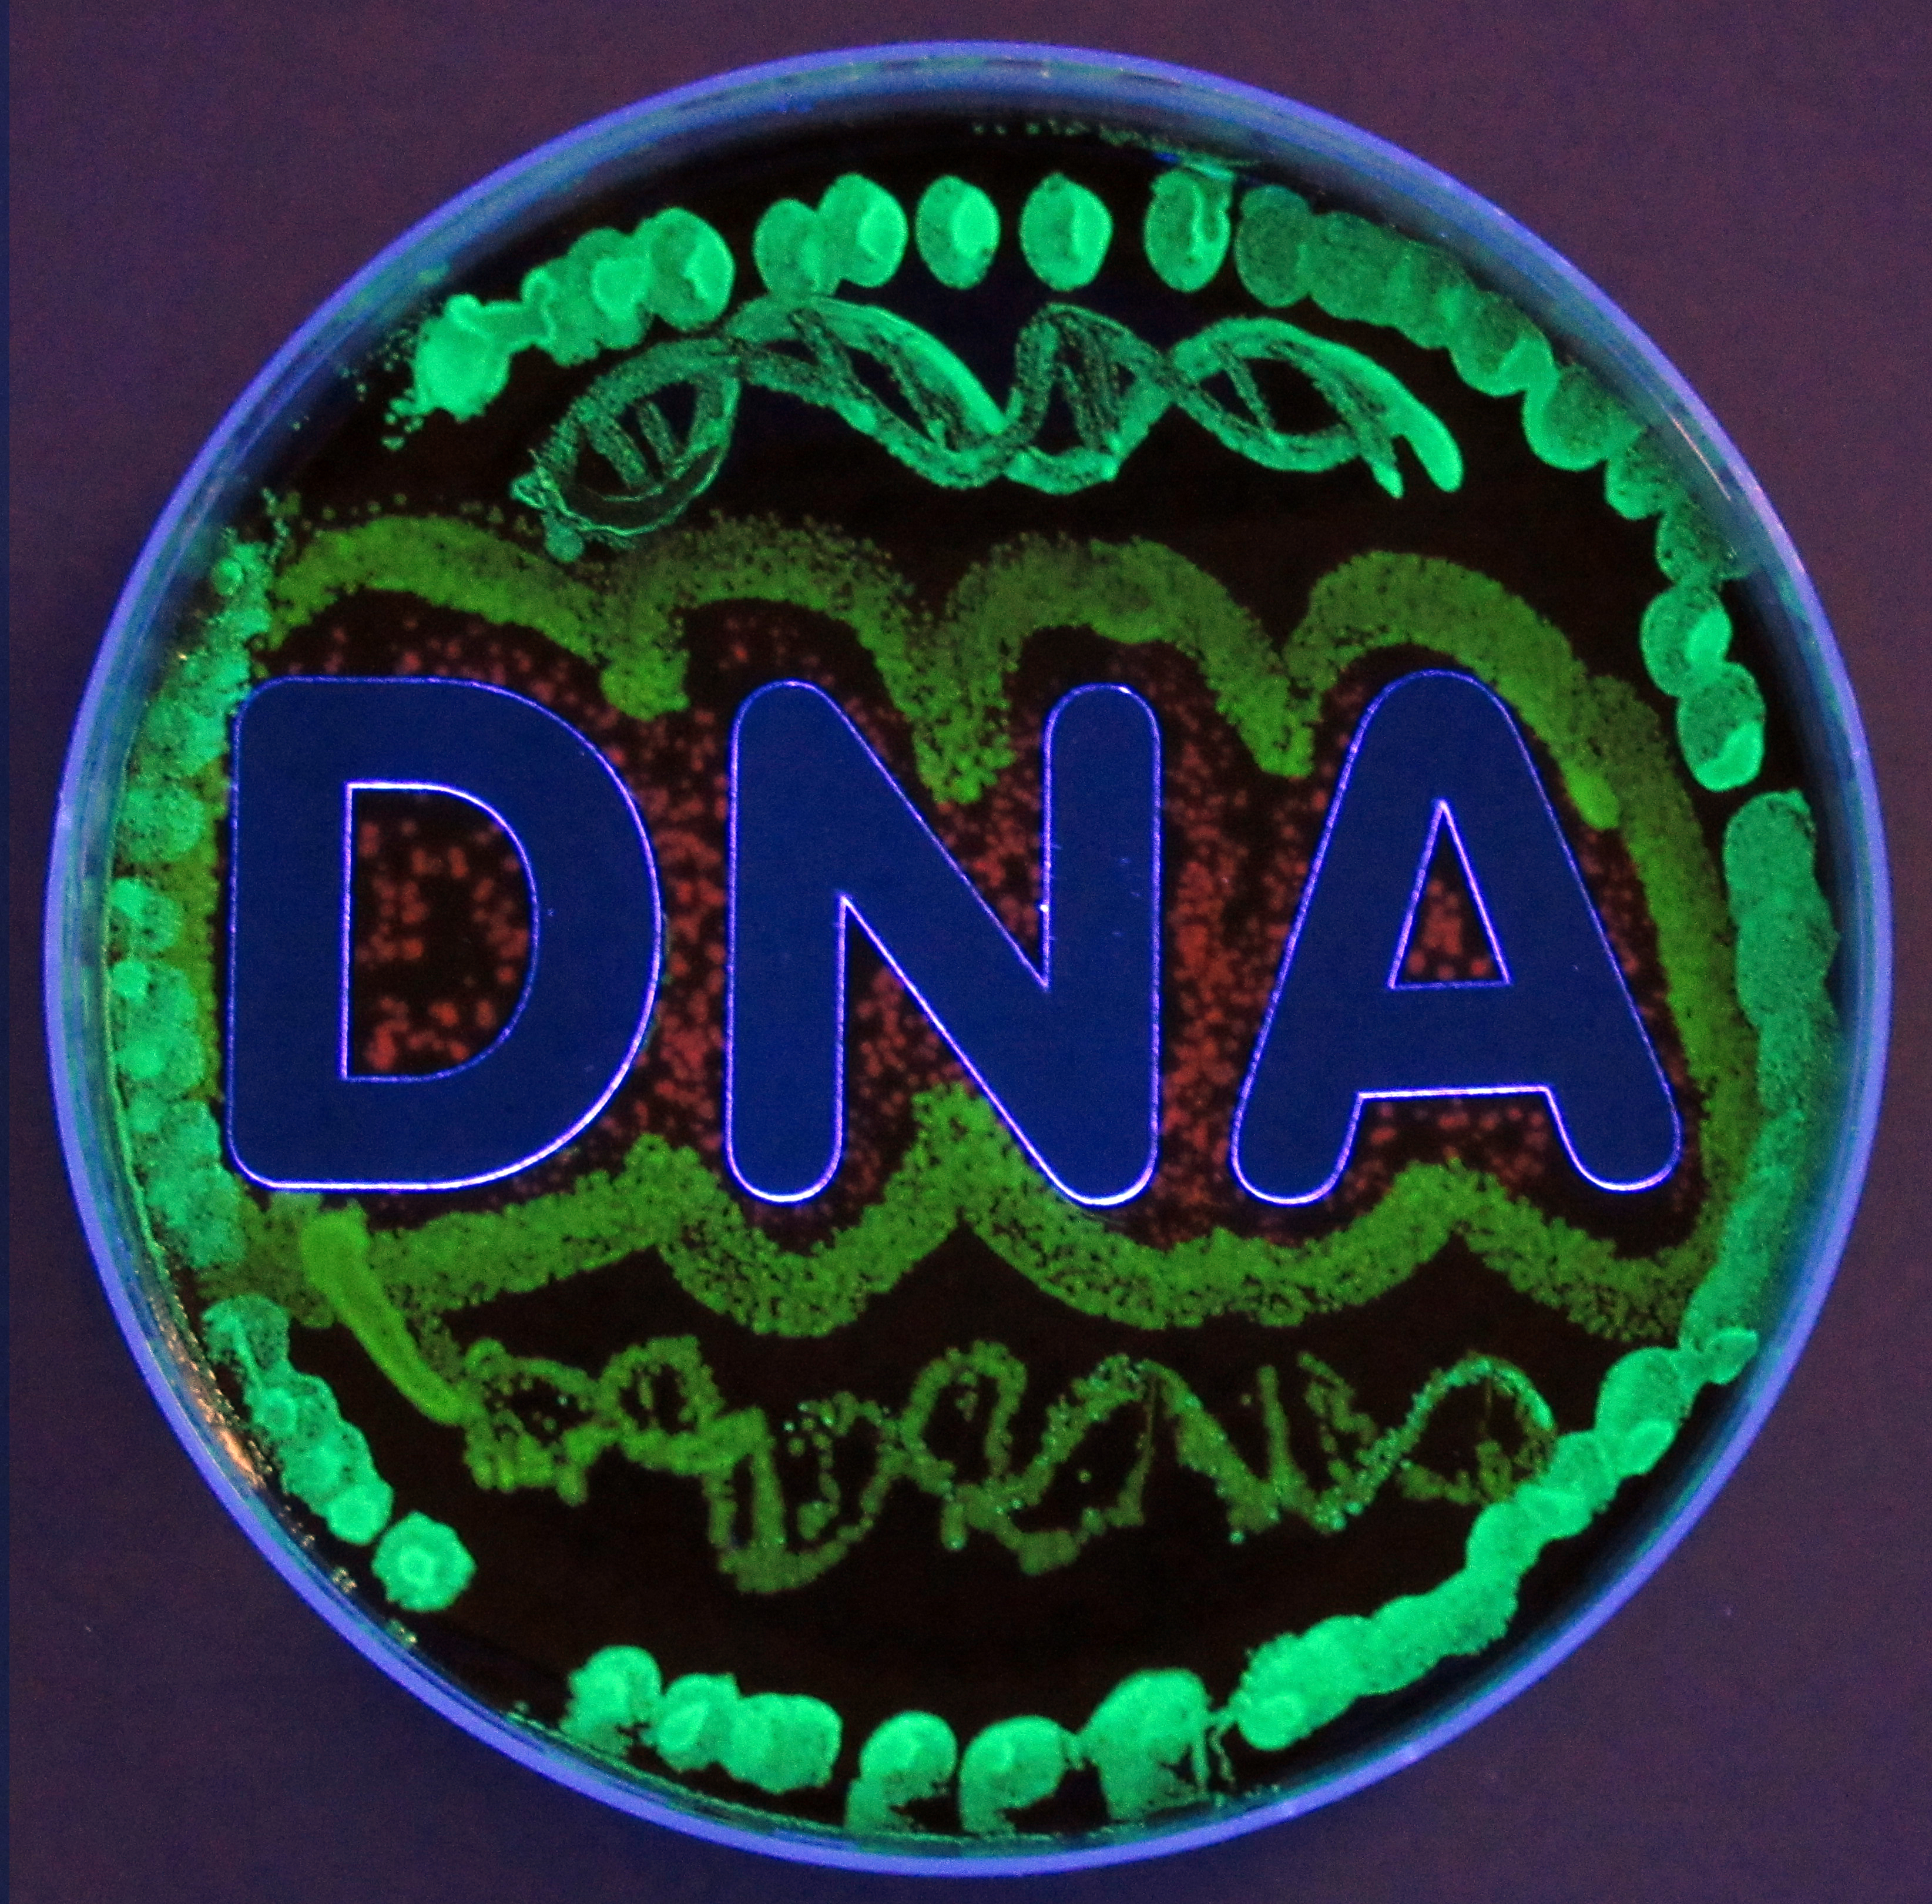 |
|
Damien de Vienne CNRS - Université Lyon 1, Exploring the entire Tree of Life with Lifemap Lifemap is an online tool (http://lifemap.univ-lyon1.fr) that allows the exploration of the entire Tree of Life or any large tree (millions of tips). This illustration is a screenshot of Lifemap showing the Viridiplantae, a group comprising more than 160,000 species. Lifemap relies on tools that were developed for cartography, especially in the context of the OpenStreetMap project, and proposes a new way of representing hierarchical structures. The exploration of the ToL in Lifemap is similar to the exploration of a geographic map: by zooming and panning. Lifemap comes in three versions, depending on the tree that is displayed and the information that is associated to nodes and tips when clicking. A first version displays the tree proposed by the Open Tree of Life (OTOL) project, a second one displays the whole NCBI taxonomy, and a third one displays a simplified version of the taxonomy with pictures and descriptions when clicking on the nodes. | 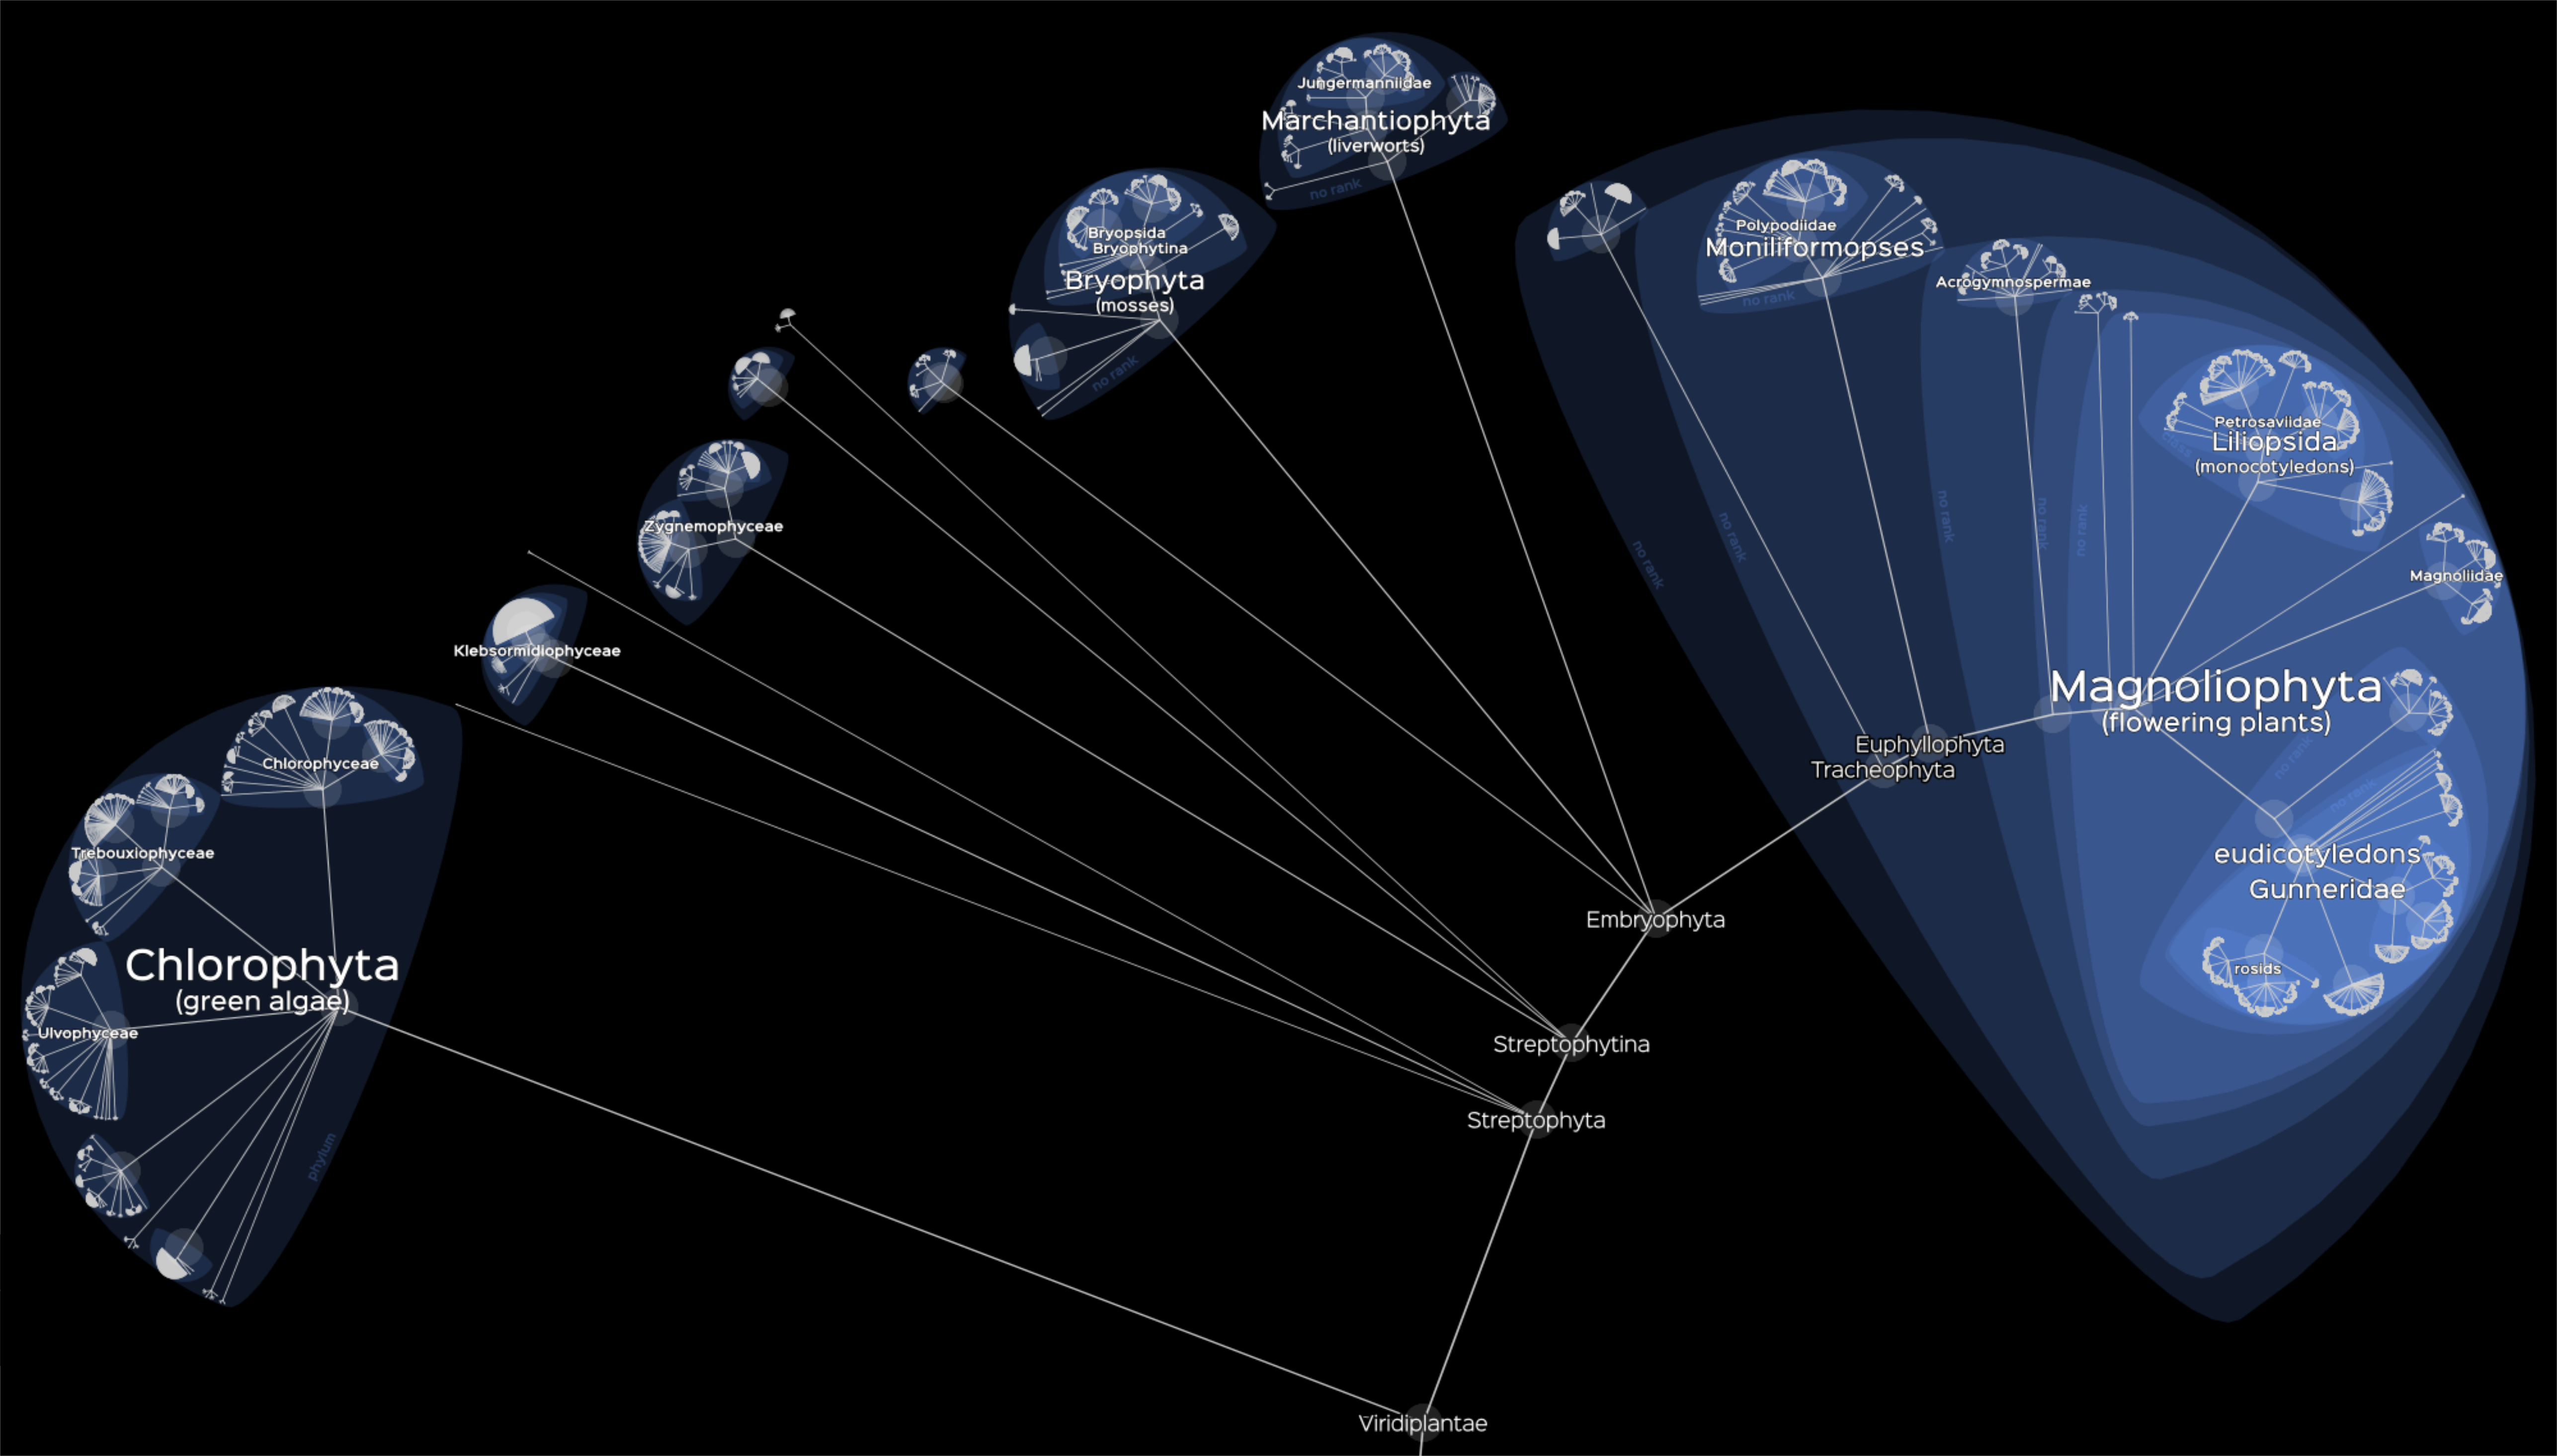 |
|
Nan Xiao Central South University, The Deep Connection between Drugs and Side Effects Identifying potential adverse drug reactions (ADRs) is essential for drug discovery and public health. This figure is a visualization of a large-scale drug–ADR interaction network. To precisely visualize the 24,803 associations between 746 drugs and 817 ADRs, the drugs with the same Anatomical Therapeutic Chemical (ATC) level were bundled together, while the ADRs with the same System Organ Classes (SOC) level were grouped together, using an edge bundling technique. The length of the bars of the ATC levels on the outer ring represents the percentage of SOC levels at each ATC level, and vice versa. From this figure, nervous system agents have a broad range of ADRs, covering most of SOC categories. Significantly, nervous system agents usually cause nervous system disorders. Cardiovascular drugs often cause cardiac diseases. The drugs applied to sensory organs often lead to eye disorders. | 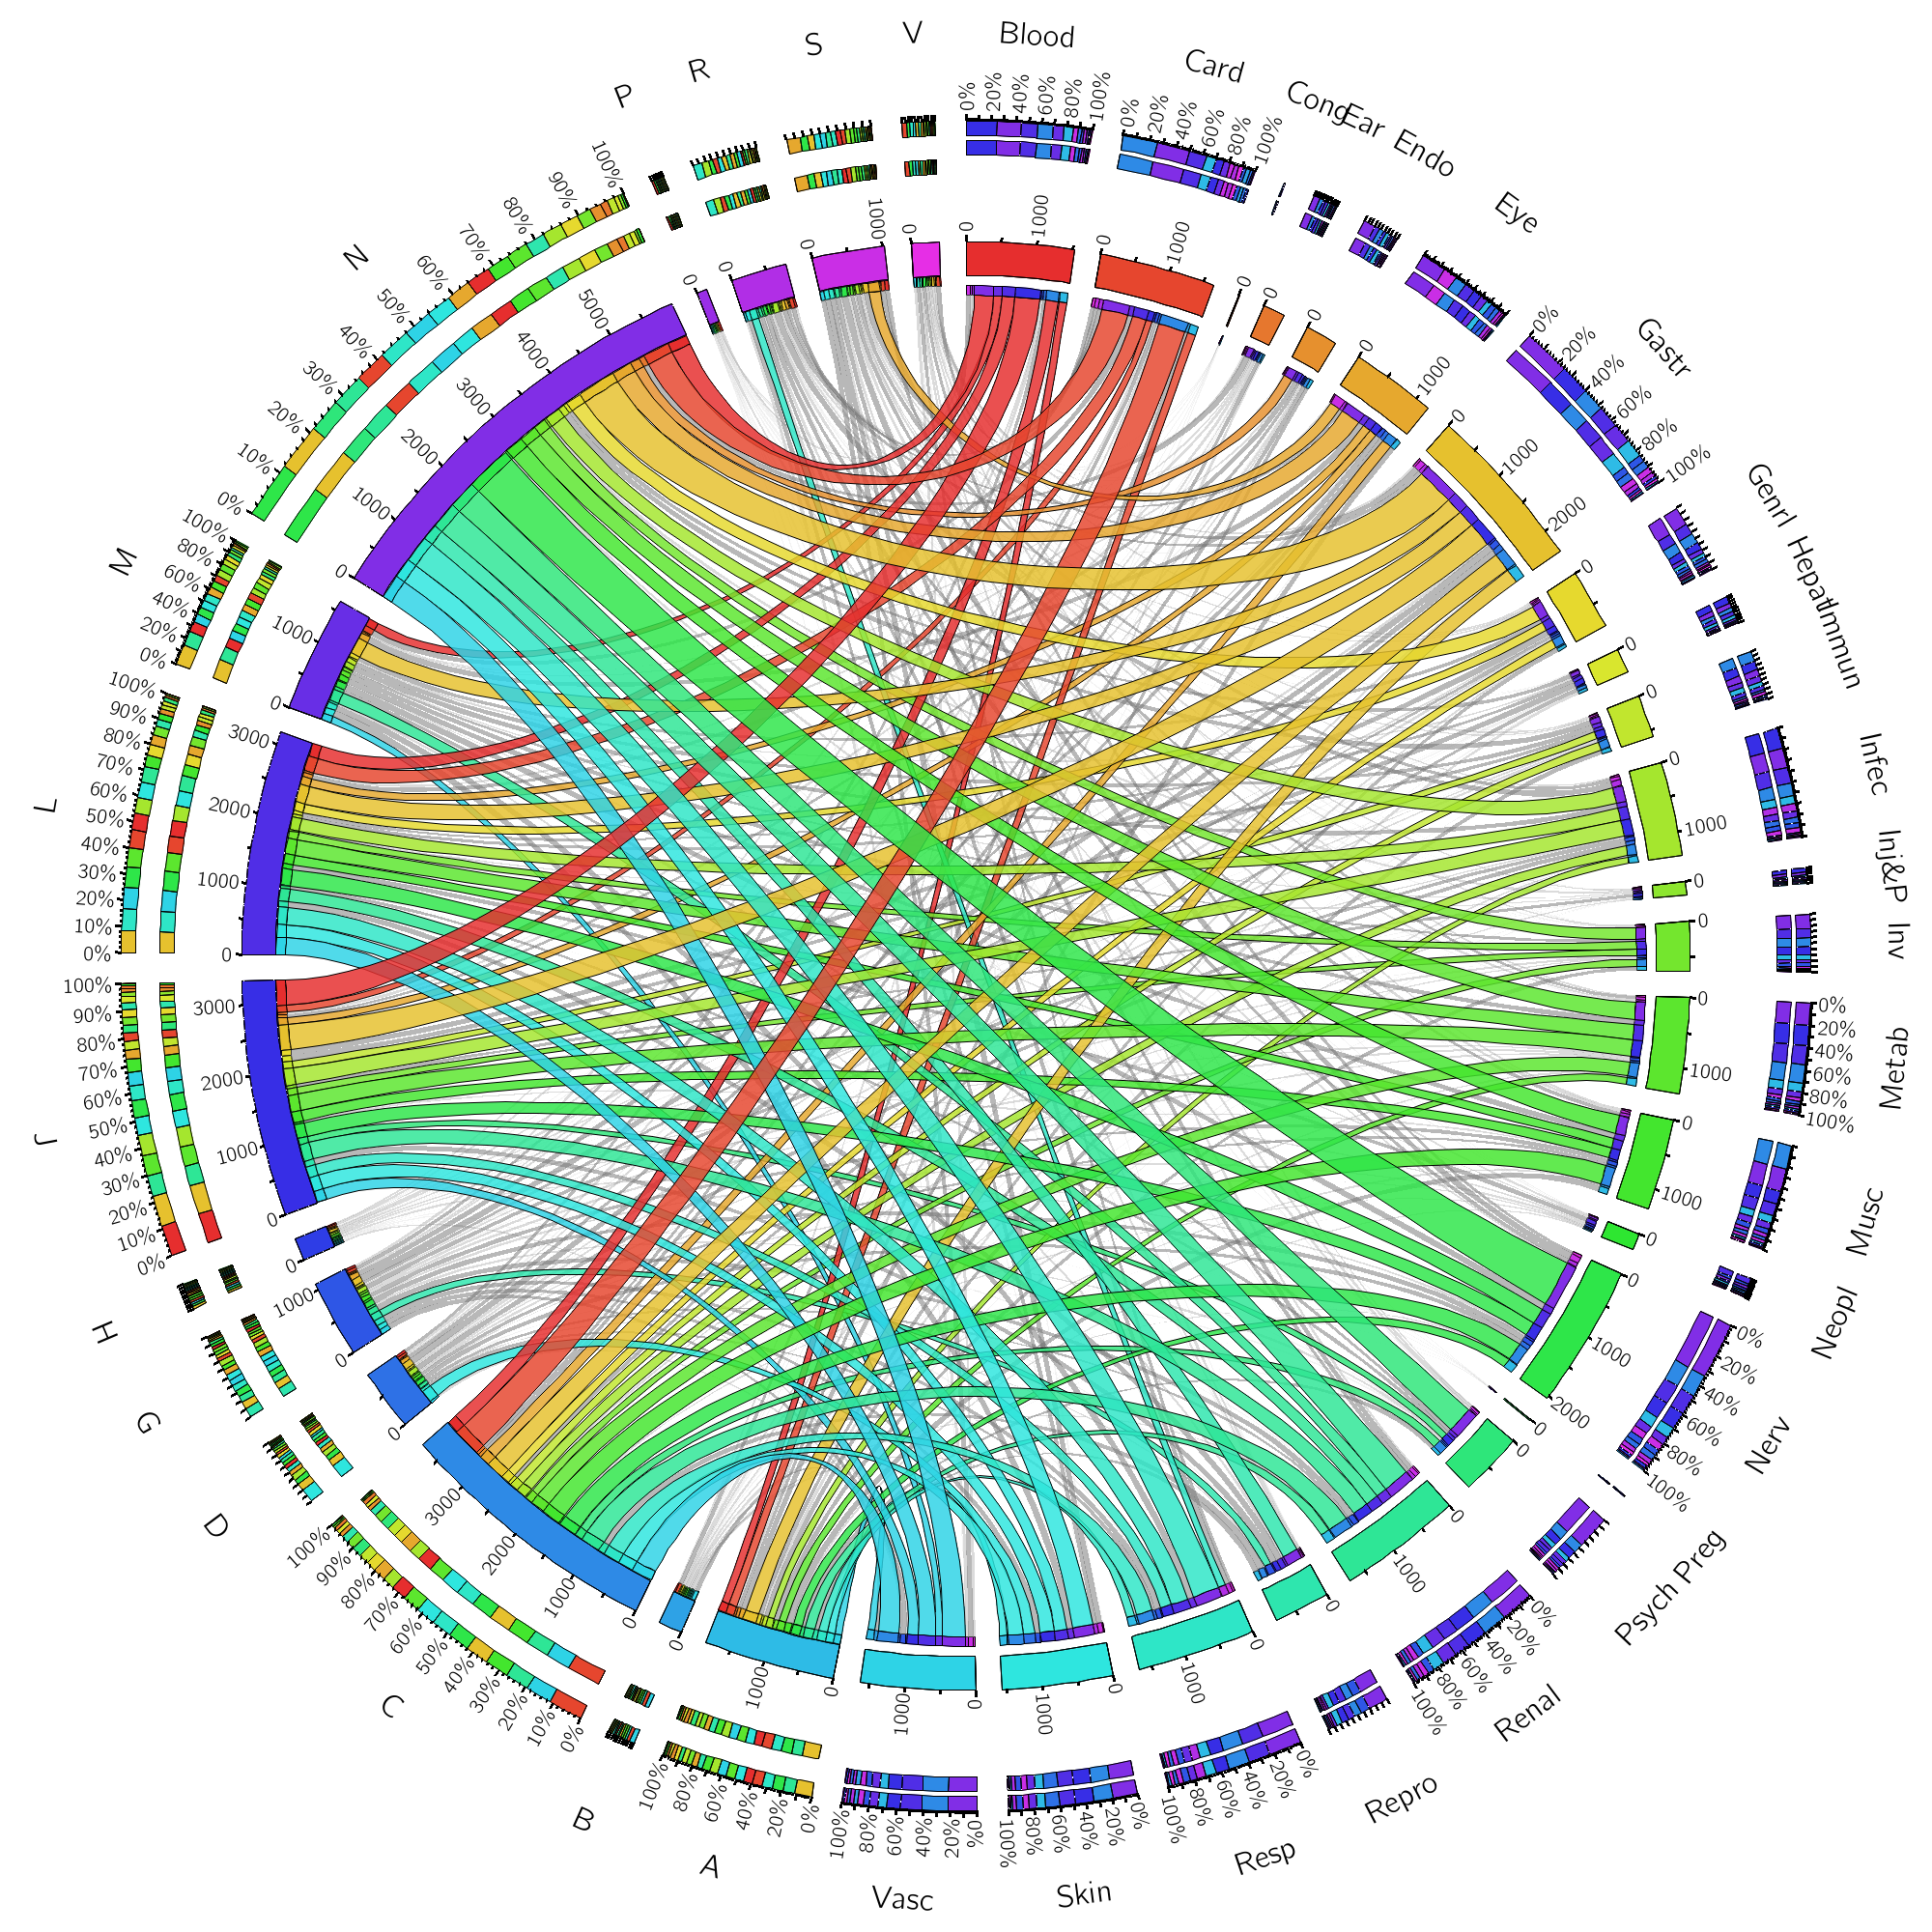 |
|
Benedetta Frida Baldi The Garvan Institute of Medical Research, Minard->o: how Napoleon marched into phosphoproteomic data This artwork is an homage to how Charles Joseph Minard and his famous visualization of Napoleon’s Russian campaign of 1812 inspired the Minardo layout for phosphoproteomic data (https://minardo.org/). The artwork focuses on creating a seamless transition between Minard’s graph and Minardo visualization, playing with the idea that if Minard had access to phosphoproteomics data, he could have designed the same layout himself. Minard condensed a large amount of information about troops, climate and terrain in a clear and concise graph. Similarly, the Minardo layout condenses thousands of phosphorylation events, with time and cellular location. The art piece flows from left to right, morphing the Minard visualization into Minardo: troop movements around Russia turn into tracks of protein complexes moving around cell compartments; temperature annotations at specific locations become phosphorylation events at specific amino acid residues of various substrates. Minard’s description of the graph was replaced with the abstract of the first Cell SnapShot published using the Minardo layout in 2015 (SnapShot: Insulin/IGF1 Signaling. DKG Ma et al. In Cell 161, no.4(2015): 948-948), using a similar handwritten font and a similar formatting style. The phosphoproteomics data - shown on the right hand side of the artwork- are a small sample of the data shown in the latest Cell SnapShot, depicting the phosphoregulation of mitosis (-in publication, see http://odonoghuelab.org:8062/). The mitosis SnapShot colour scheme, as well as the thickness of various tracks were changed to blend with the Minard visualization. |  |
|
Julian Gough Cambridge University, The landscape of human cell type. Cherrie H.T. Kong, Julian Gough In 1957, Conrad Waddington famously drew a sketch of an imagined epigenetic landscape. This is the first image of the actual landscape of human cell type. Based on real experimental data (Rackham et al. 2016, Nature Genetics), the mountain scene has been graphically rendered from Mogrify analysis (mogrify.net) of over 300 human cell types and tissues from the FANTOM5 dataset. This scene translates a set of complex biological relationships into a familiar landscape. It is a map of cellular differentiation, where molecularly-similar cell types are closer together in latitude and longitude, while cell types with greater potential, such as stem cells, are higher in altitude. | 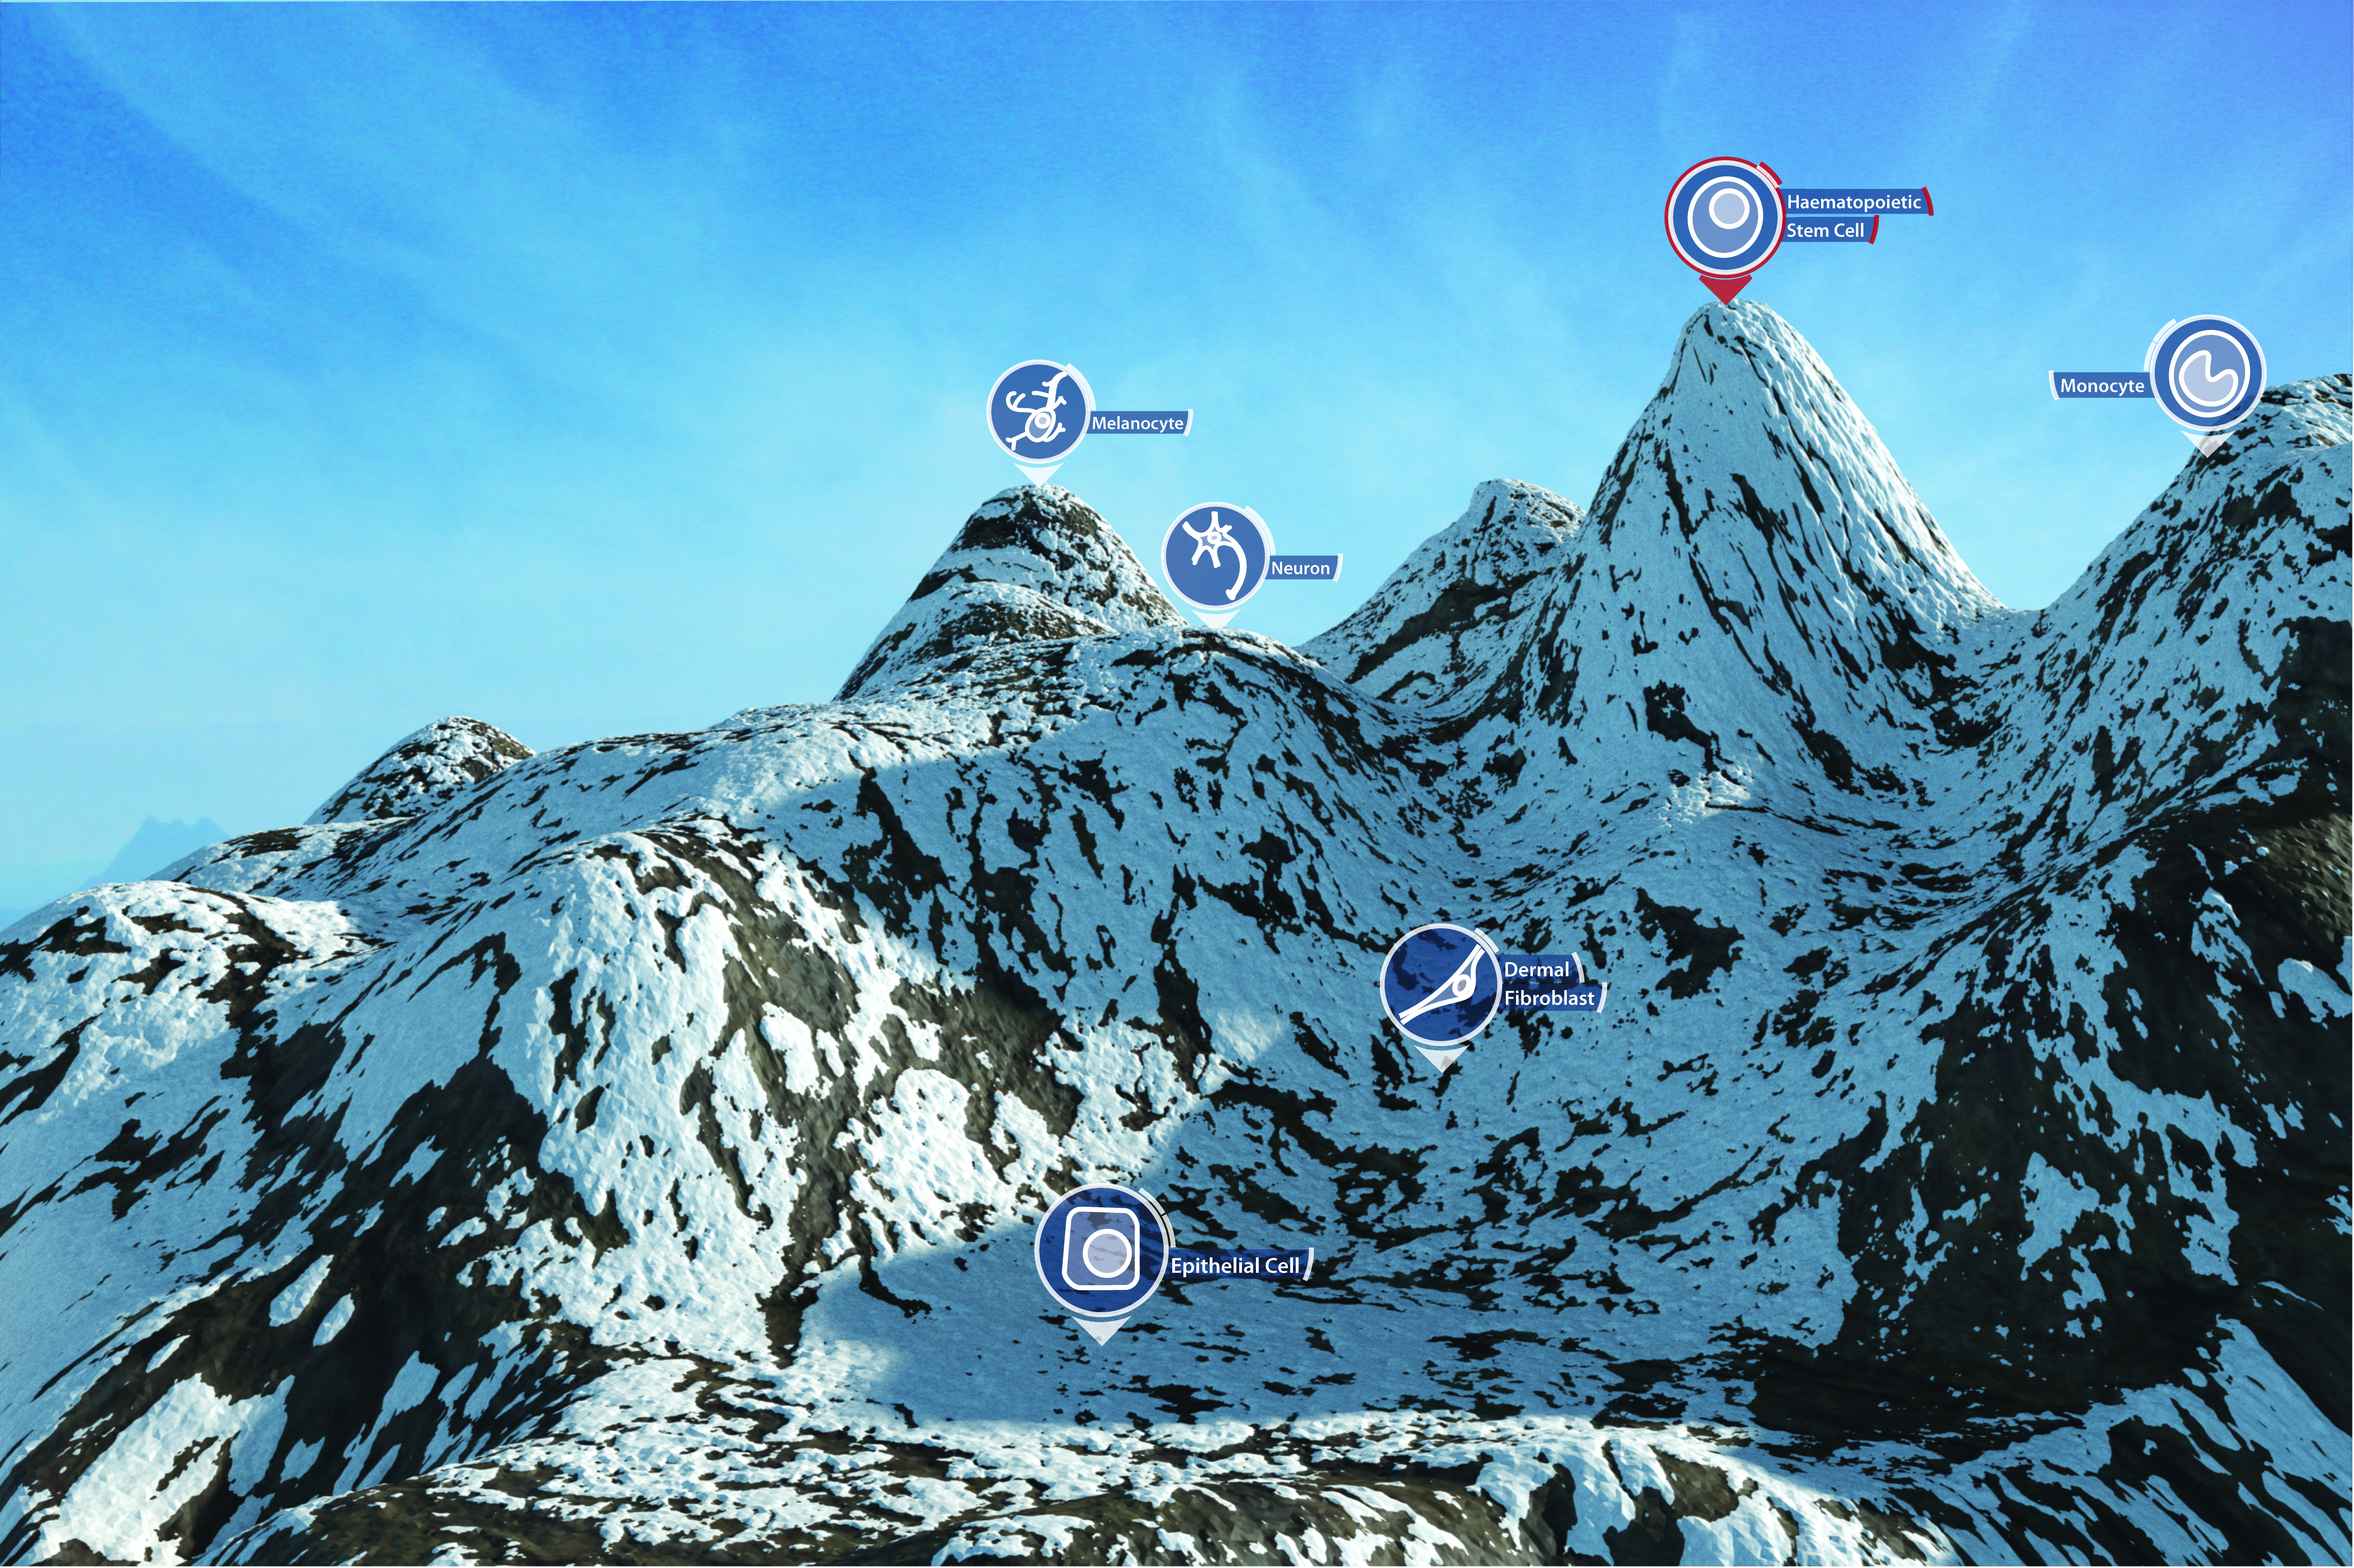 |